BlueGlobe is Intelligent Reality’s data intelligence platform, supporting data fusion, analysis and visualisation in space, time and context. Its particular focus is in supporting environmental and climate intelligence, in applications ranging from land management to Net Zero planning and public health.
What is it?
BlueGlobe’s goal is the creation of a ‘Digital Twin‘ for planet Earth: an online toolbox to give individuals, communities, governments and enterprises the means to engage with, understand and visualise the impact of their activities on the natural and human environments.
BlueGlobe brings together a plethora of data sources including demographics, satellite, surveys, events, news, reports and sensors. It then translates that data into a common stack of interconnected information at resolutions from thousands of km2 to a few square metres.
From this we create unified measures, trends, forecasts and complex analytics for multiple applications in environmental and climate health, using an ensemble of geospatial analysis, mathematical and statistical approaches and artificial intelligence.


Why BlueGlobe?
Our civilisation faces two critical and intertwined challenges: Climate Change and environmental degradation.
The ‘big’ Climate Change models provide effective and robust, long-term forecasts of global and regional change and of the broader impact on our environment and lives.
These don’t however provide individuals, communities, governments and enterprises with the accessible tools and data to allow them to explore what is happening in their own areas, to formulate policies and plans, to examine and forecast their likely impact and – over time – to monitor outcomes and refine their approach.
Climate change response and planning for mitigation and adaptation has therefore – of necessity – been more driven by hope than understanding, with initiatives taking ‘checkbox’ approaches, where available tools and initiatives are fragmented, partial, and lack the ability to support formulation and enactment of policies that meet their specific needs and those of the areas for which they are responsible.
Organisations taking this approach – whatever the virtue of their intent – then become open to the charge of ‘greenwashing’, simply through the lack of the tools that would enable them to create and enact policies based on relevant and integrated real-world data and forecasts.
BlueGlobe sets out to close that gap.
What are our goals?
To succeed, we need to:
- Provide established core measures and insight
- Create a framework to which others can both add, developing tools that we haven’t even imagined yet
- Support the discovery of relationships, patterns and trends that are important to know but which we don’t yet know to look for
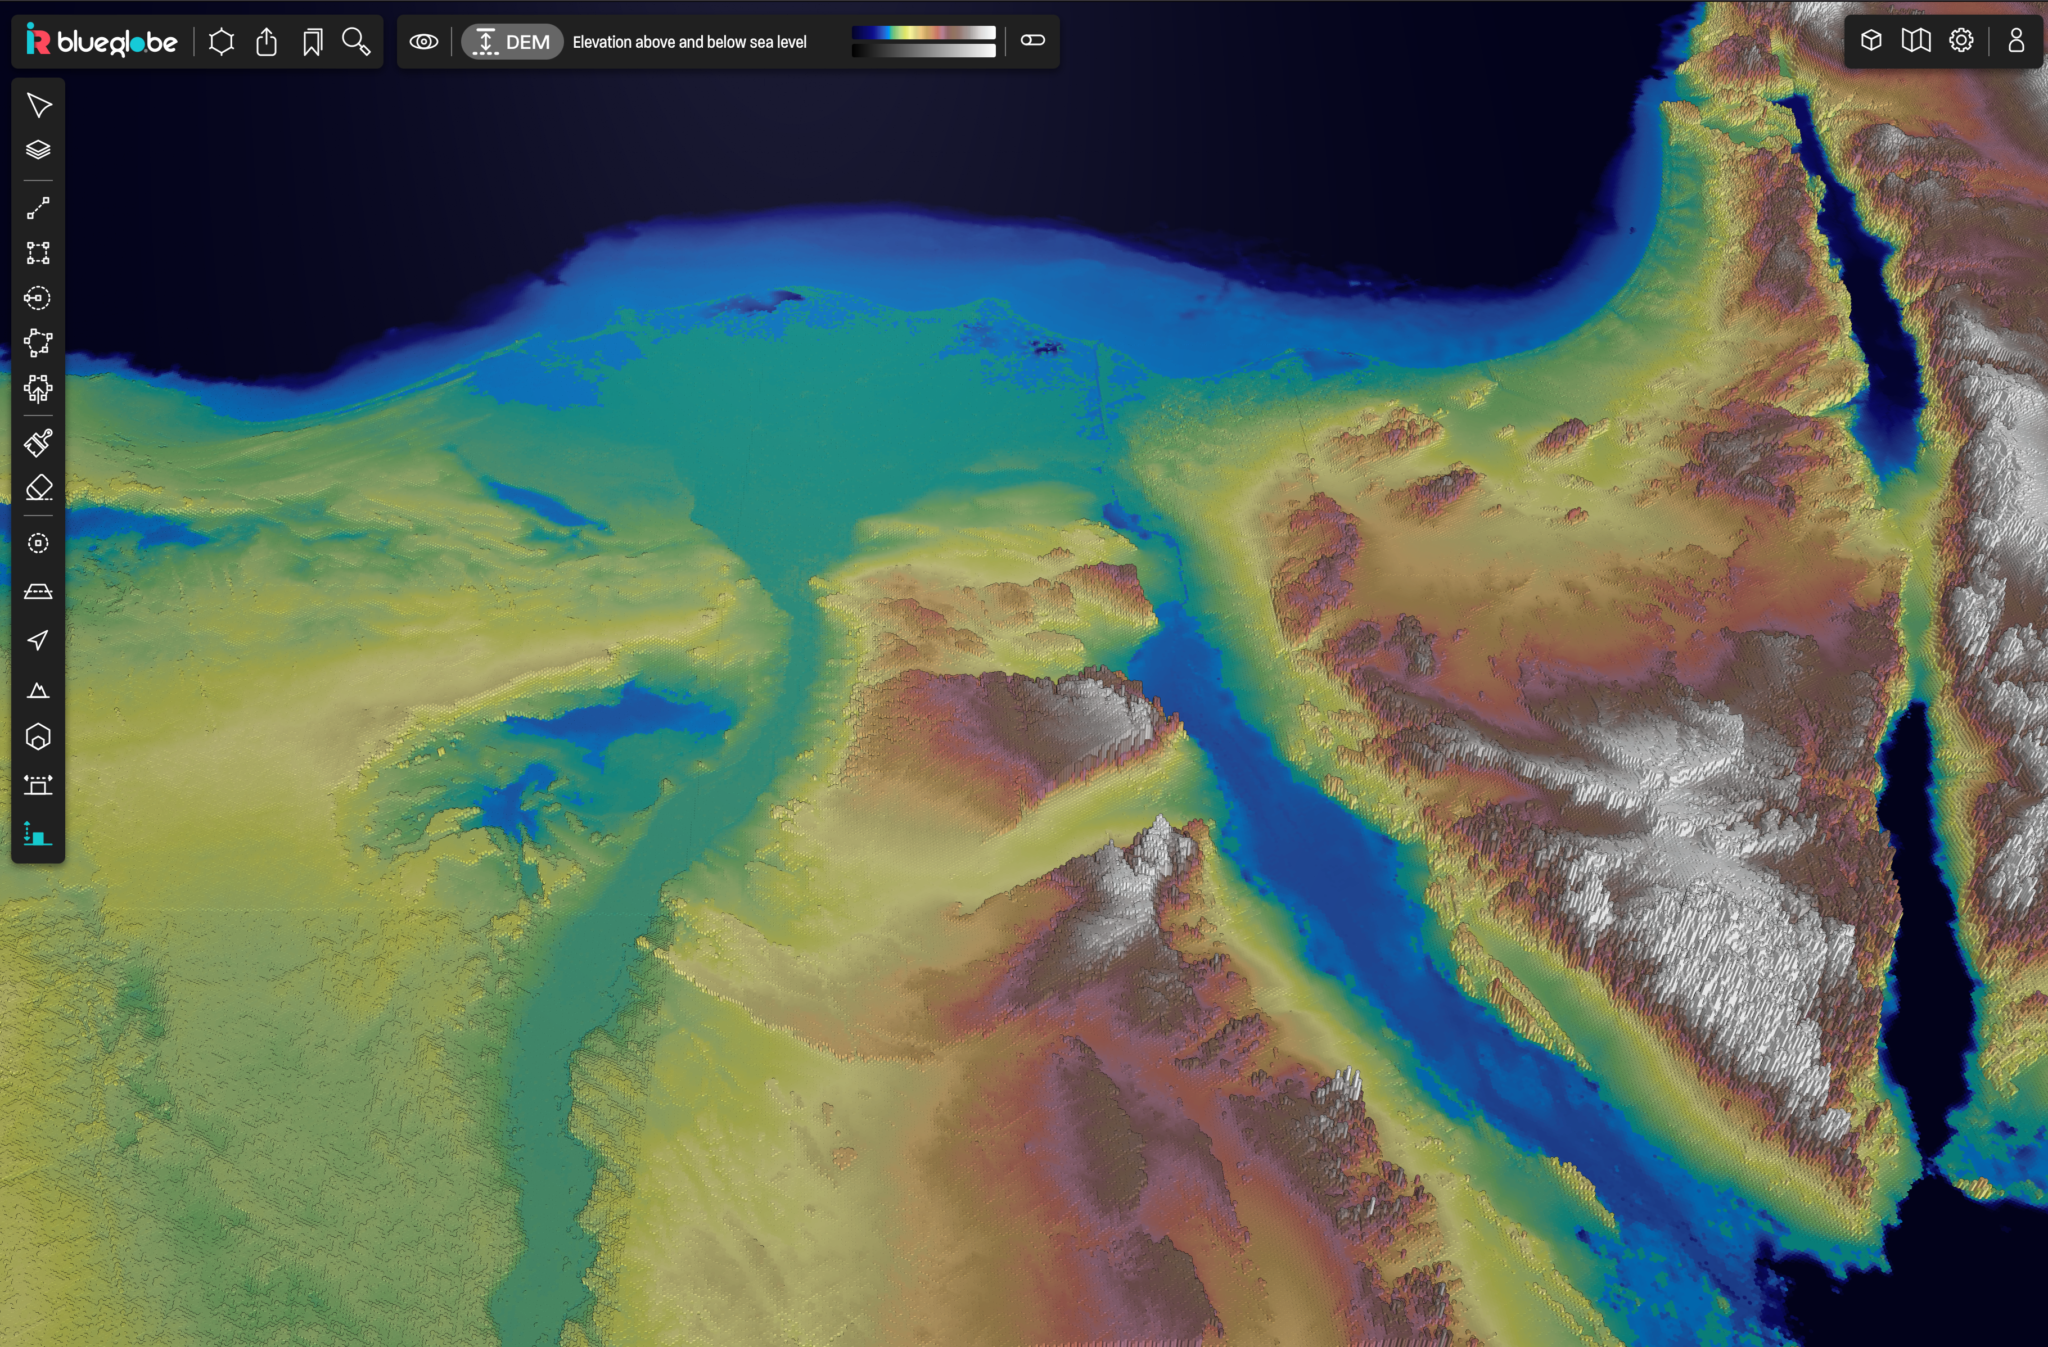
This image is BlueGlobe’s mathematical recreation of the Nile Delta, shown here in 3D, where each point is a clickable data stack for that part of the landscape.


Who is it for?
BlueGlobe is designed to support both experts – researchers and environmental professionals – and the far wider audience of need of policy makers, planners and those taking action at all levels, from the transnational to the hyperlocal, and whether they be governments, public bodies, private companies or communities seeking to take action. Of equal importance is the ability to readily provide integrated, evidence-driven information to educators and media who are helping to drive public understanding of both the problem and what we can do about it.
Researchers need an audience not just for their publications but to make their data more widely accessible. BlueGlobe provides a framework for doing so: enabling a ‘digital commons’, where individual contributions enhance the benefit to all. BlueGlobe’s framework also has the potential to enable work by researchers who may not have access to the resources, skills and facilities needed to carry out their work.
Not all data is, or should be public, of course: BlueGlobe is developing sophisticated tools for the management and integration of private and proprietary data, enabling its tools and datascape to be customised to specific organisational applications and needs.
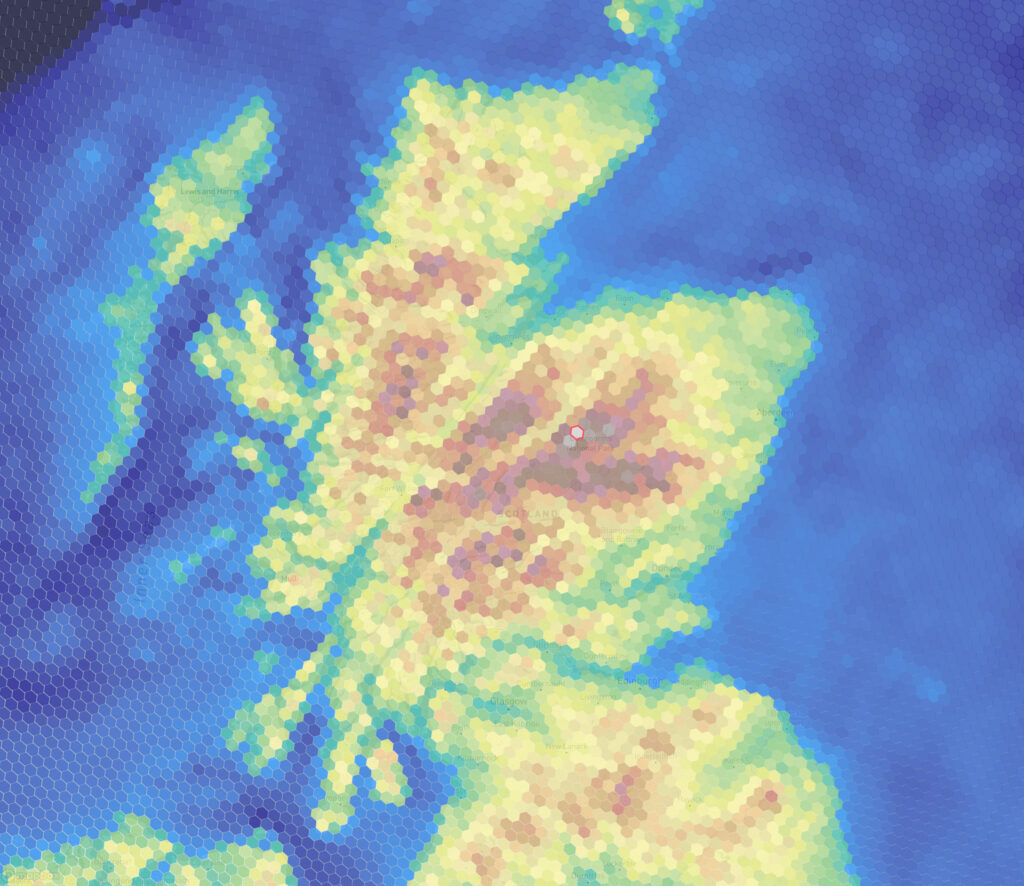
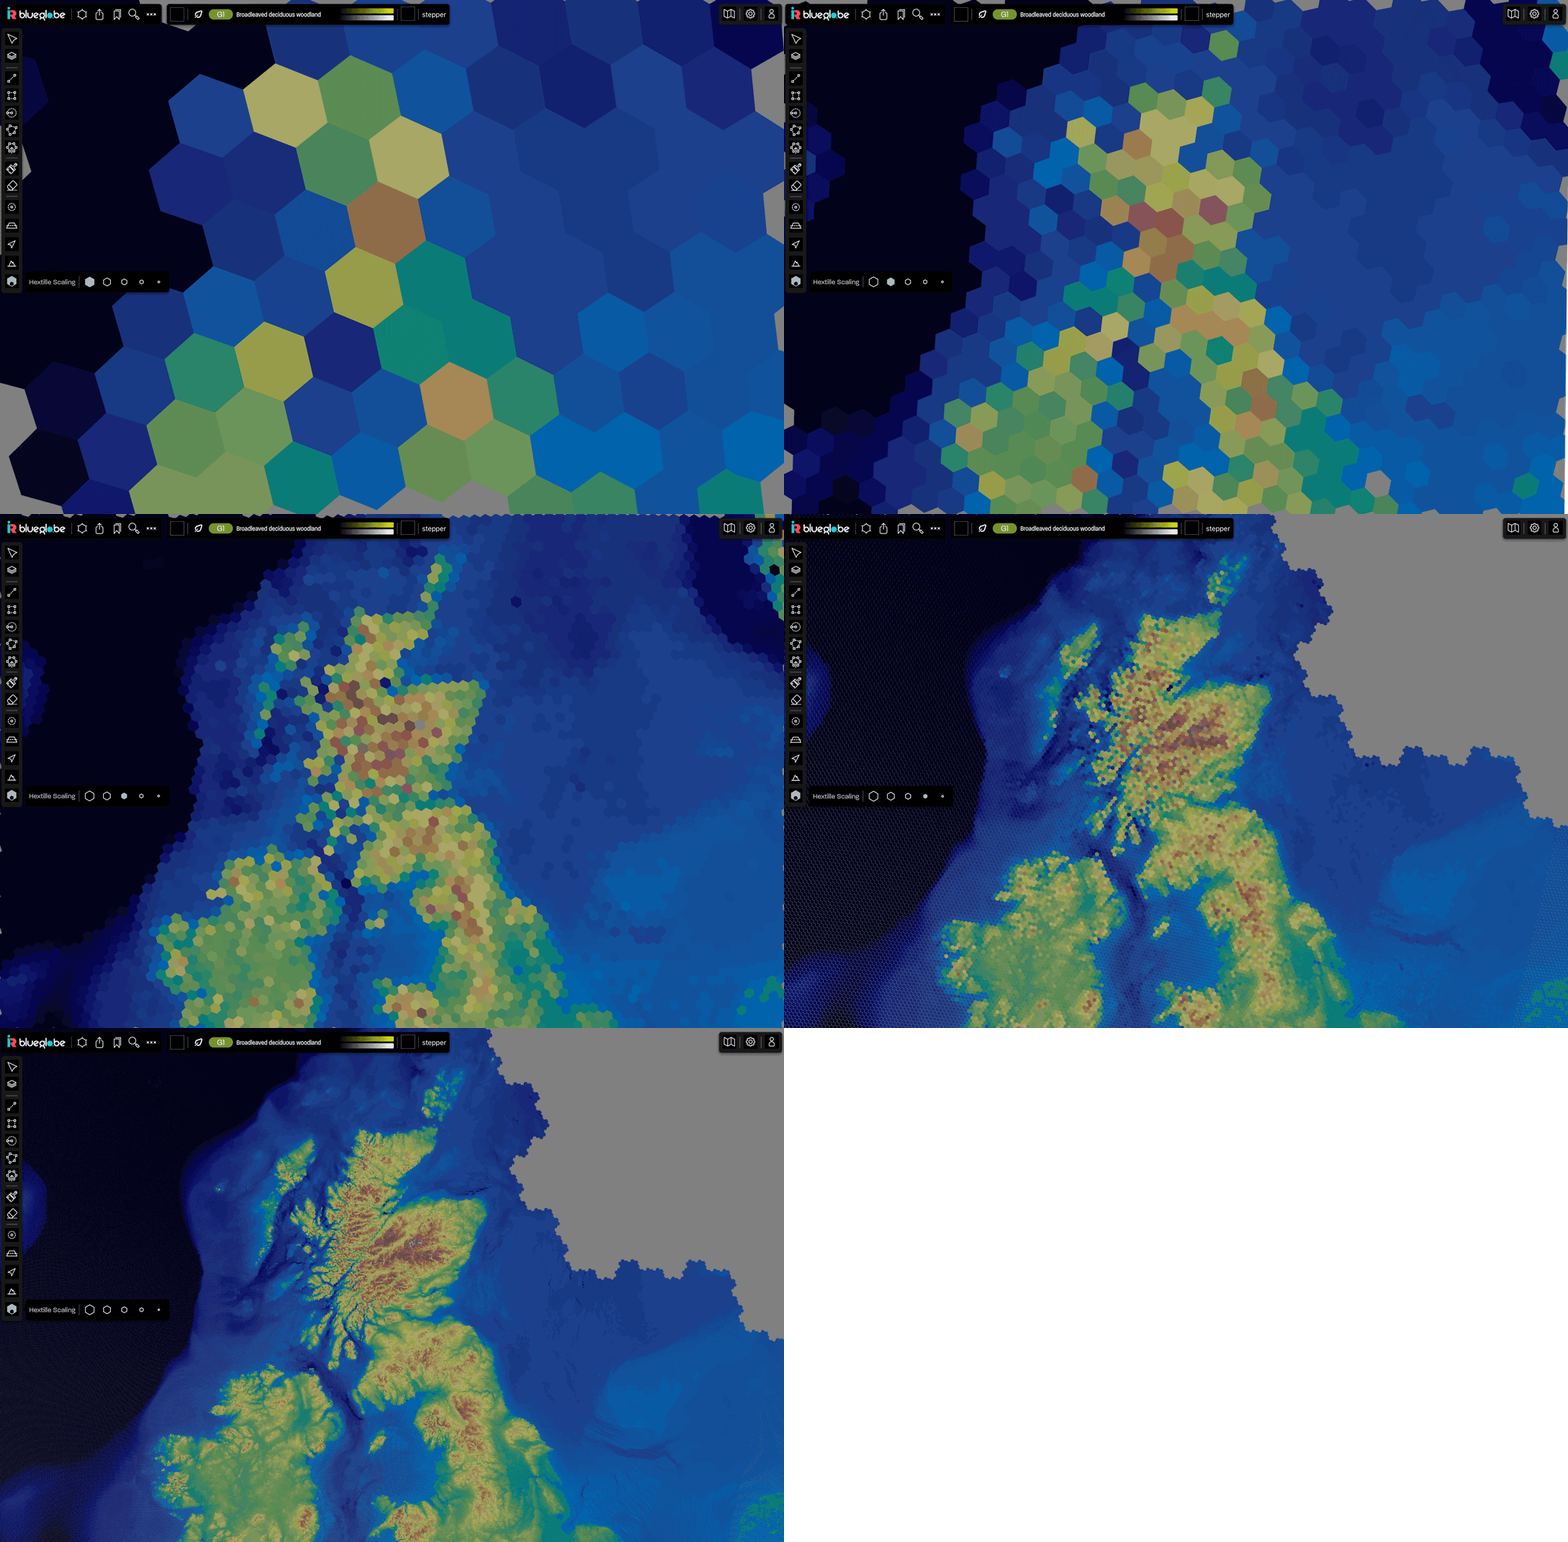
This animation shows Scotland and Northern England at multiple resolutions in BlueGlobe, where each hexagon provides a summary of all available system data for the environment, demographics and ecological health measures for that hexagon. Hexagons are assembled to match any site or area boundary to provide unified reporting and comparisons.
Current Status
As of September 2023, the BlueGlobe demonstrator is migrating to our Phase 3 global system, which has been rendered using more than 38Bn data stacks. This builds atop, and integrates our initial framework, which was created for Scotland on behalf of NatureScot with two R&D contracts from SBRI, and on our wider public health framework created for Covid-19 forecasting with three rounds of UKRI funding.
If you wish to be informed when we’re live again, please sign up to our mailing list. This will only be used to contact you regarding BlueGlobe and will not be used or shared elsewhere.
BlueGlobe won the 2022 CogX award for Best Climate Change Innovation in the Tech for Nature category (CogX is the world’s largest annual gathering devoted to the impact of artificial intelligence and other new technologies) and was a UK nominee for the 2022 Earthshot Prize.
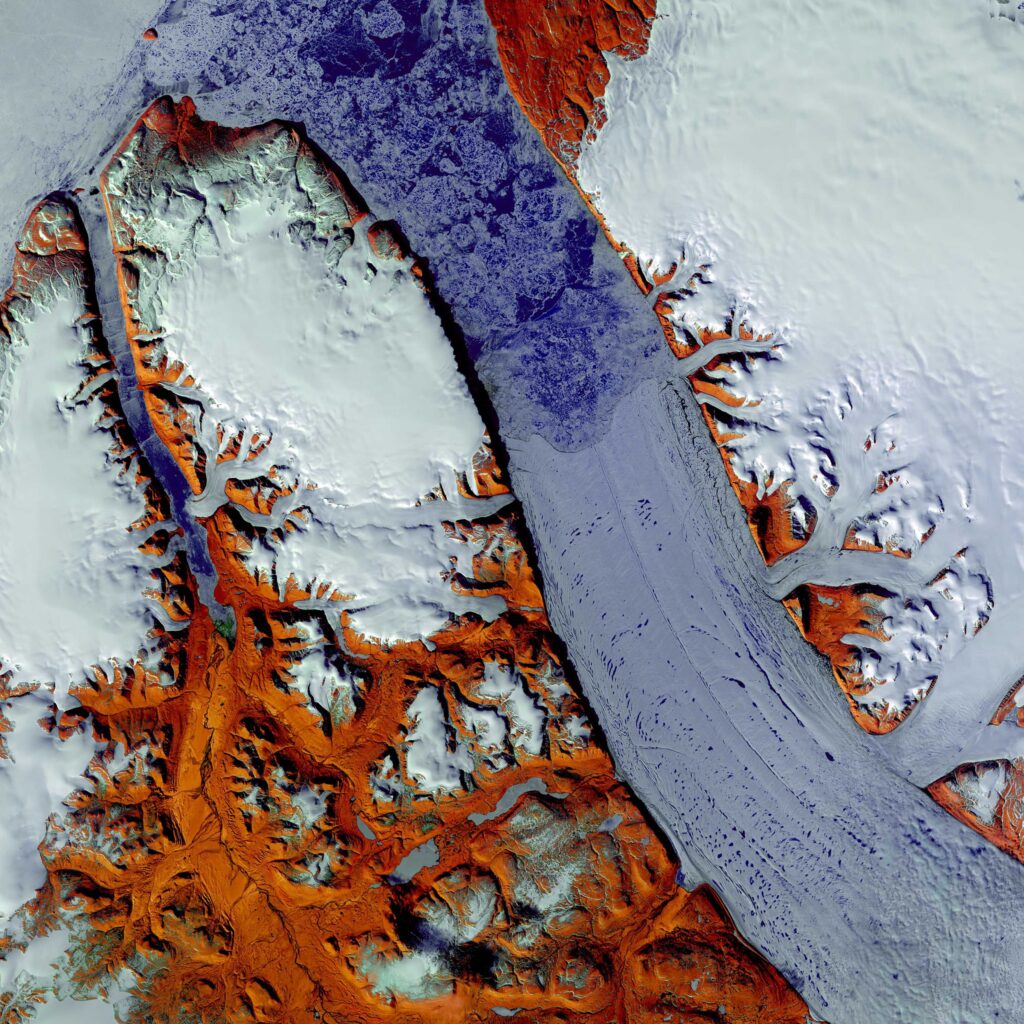
This image is a visualisation of the raw output of an AI cluster model which divides the landscape into related areas, using hundreds of different environmental, human and geographic variables.

