On Friday 29th January, the Scottish Government announced that Na h-Eileanan Siar (the Western Isles) is being put into Level 4 lockdown, following a surge of new cases.
On the basis of the data available to us and our modelling approach, we\’re not convinced about this decision: it appears to have be made on the basis of out-of-date analysis in an area which turned the corner on this outbreak some time ago.
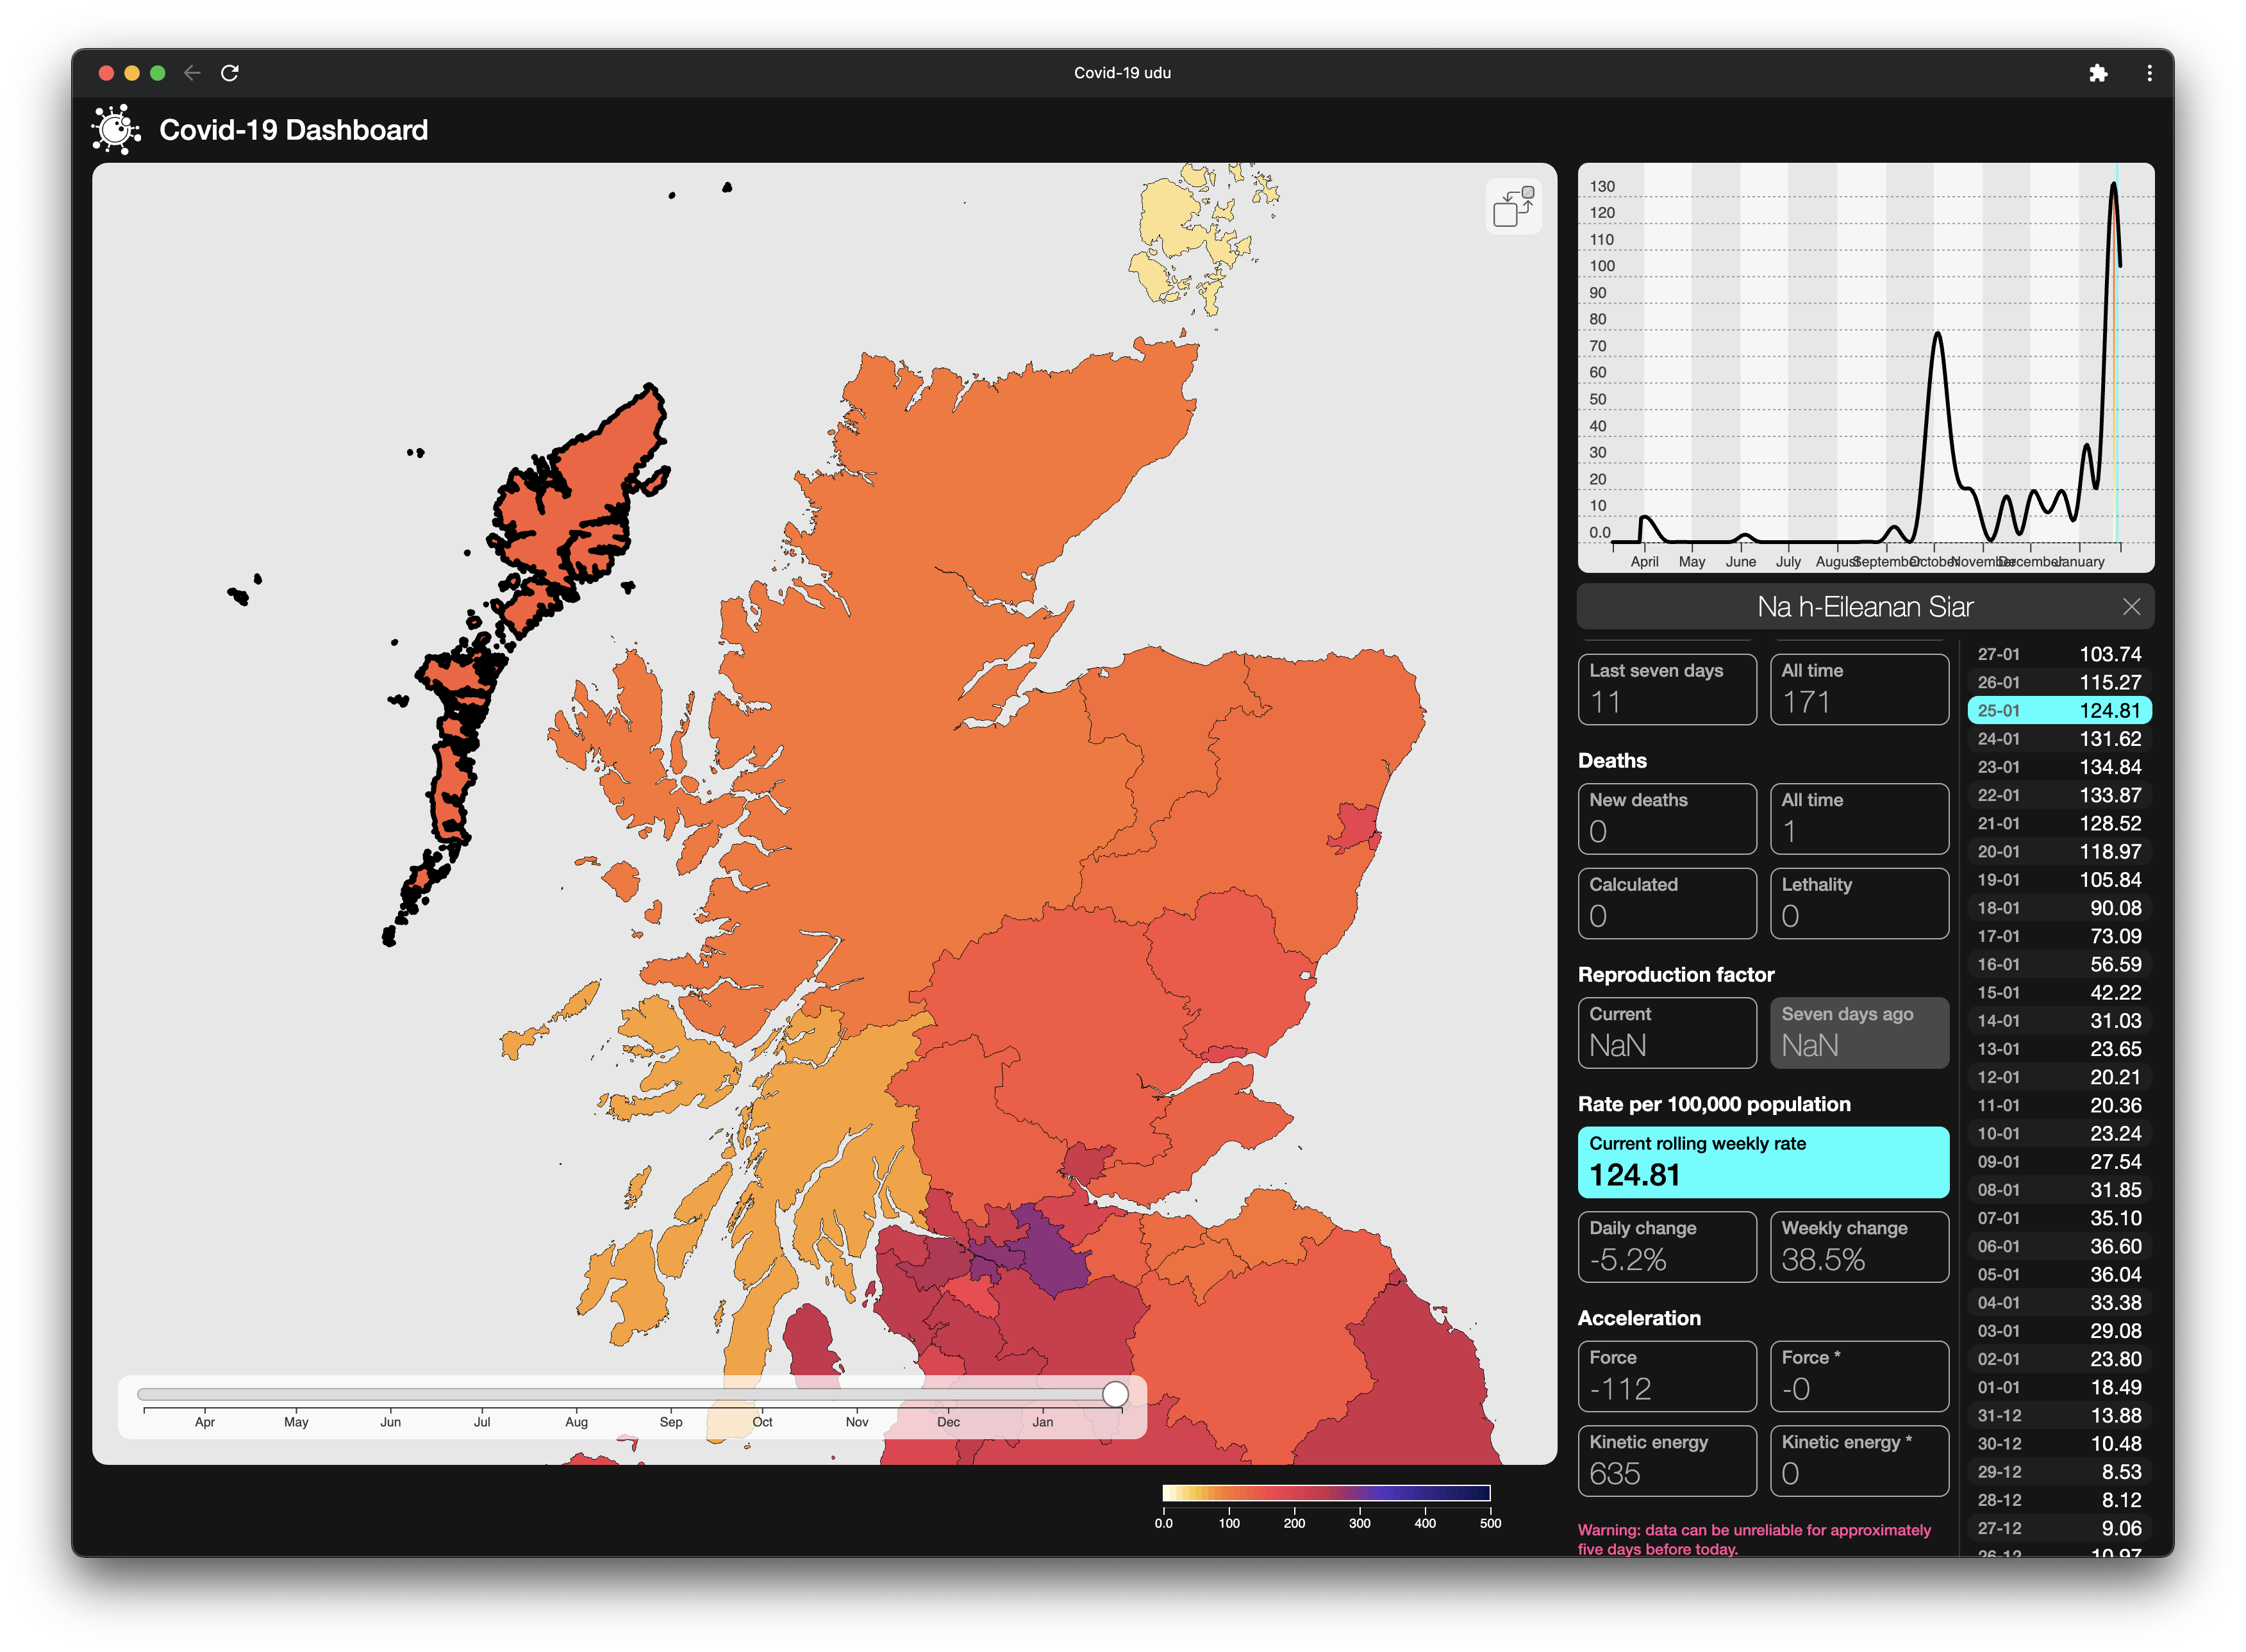
Our emergent analytics, which generate fresh outlooks every day, suggest that the peak of the outbreak here was passed on 19th January and that it has declined, on multiple metrics, since then.
Data & Analysis
To look at this, we\’re using published figures for Na h-Eileanan Siar as of and up to 25th January, with our model then compensating for potential reporting inaccuracies – it typically takes a week or so for the reported figures for any given day to stabilise. We are also dealing here with an area where the actual numbers are sufficiently low to make any attempt at prediction of doubtful quality.
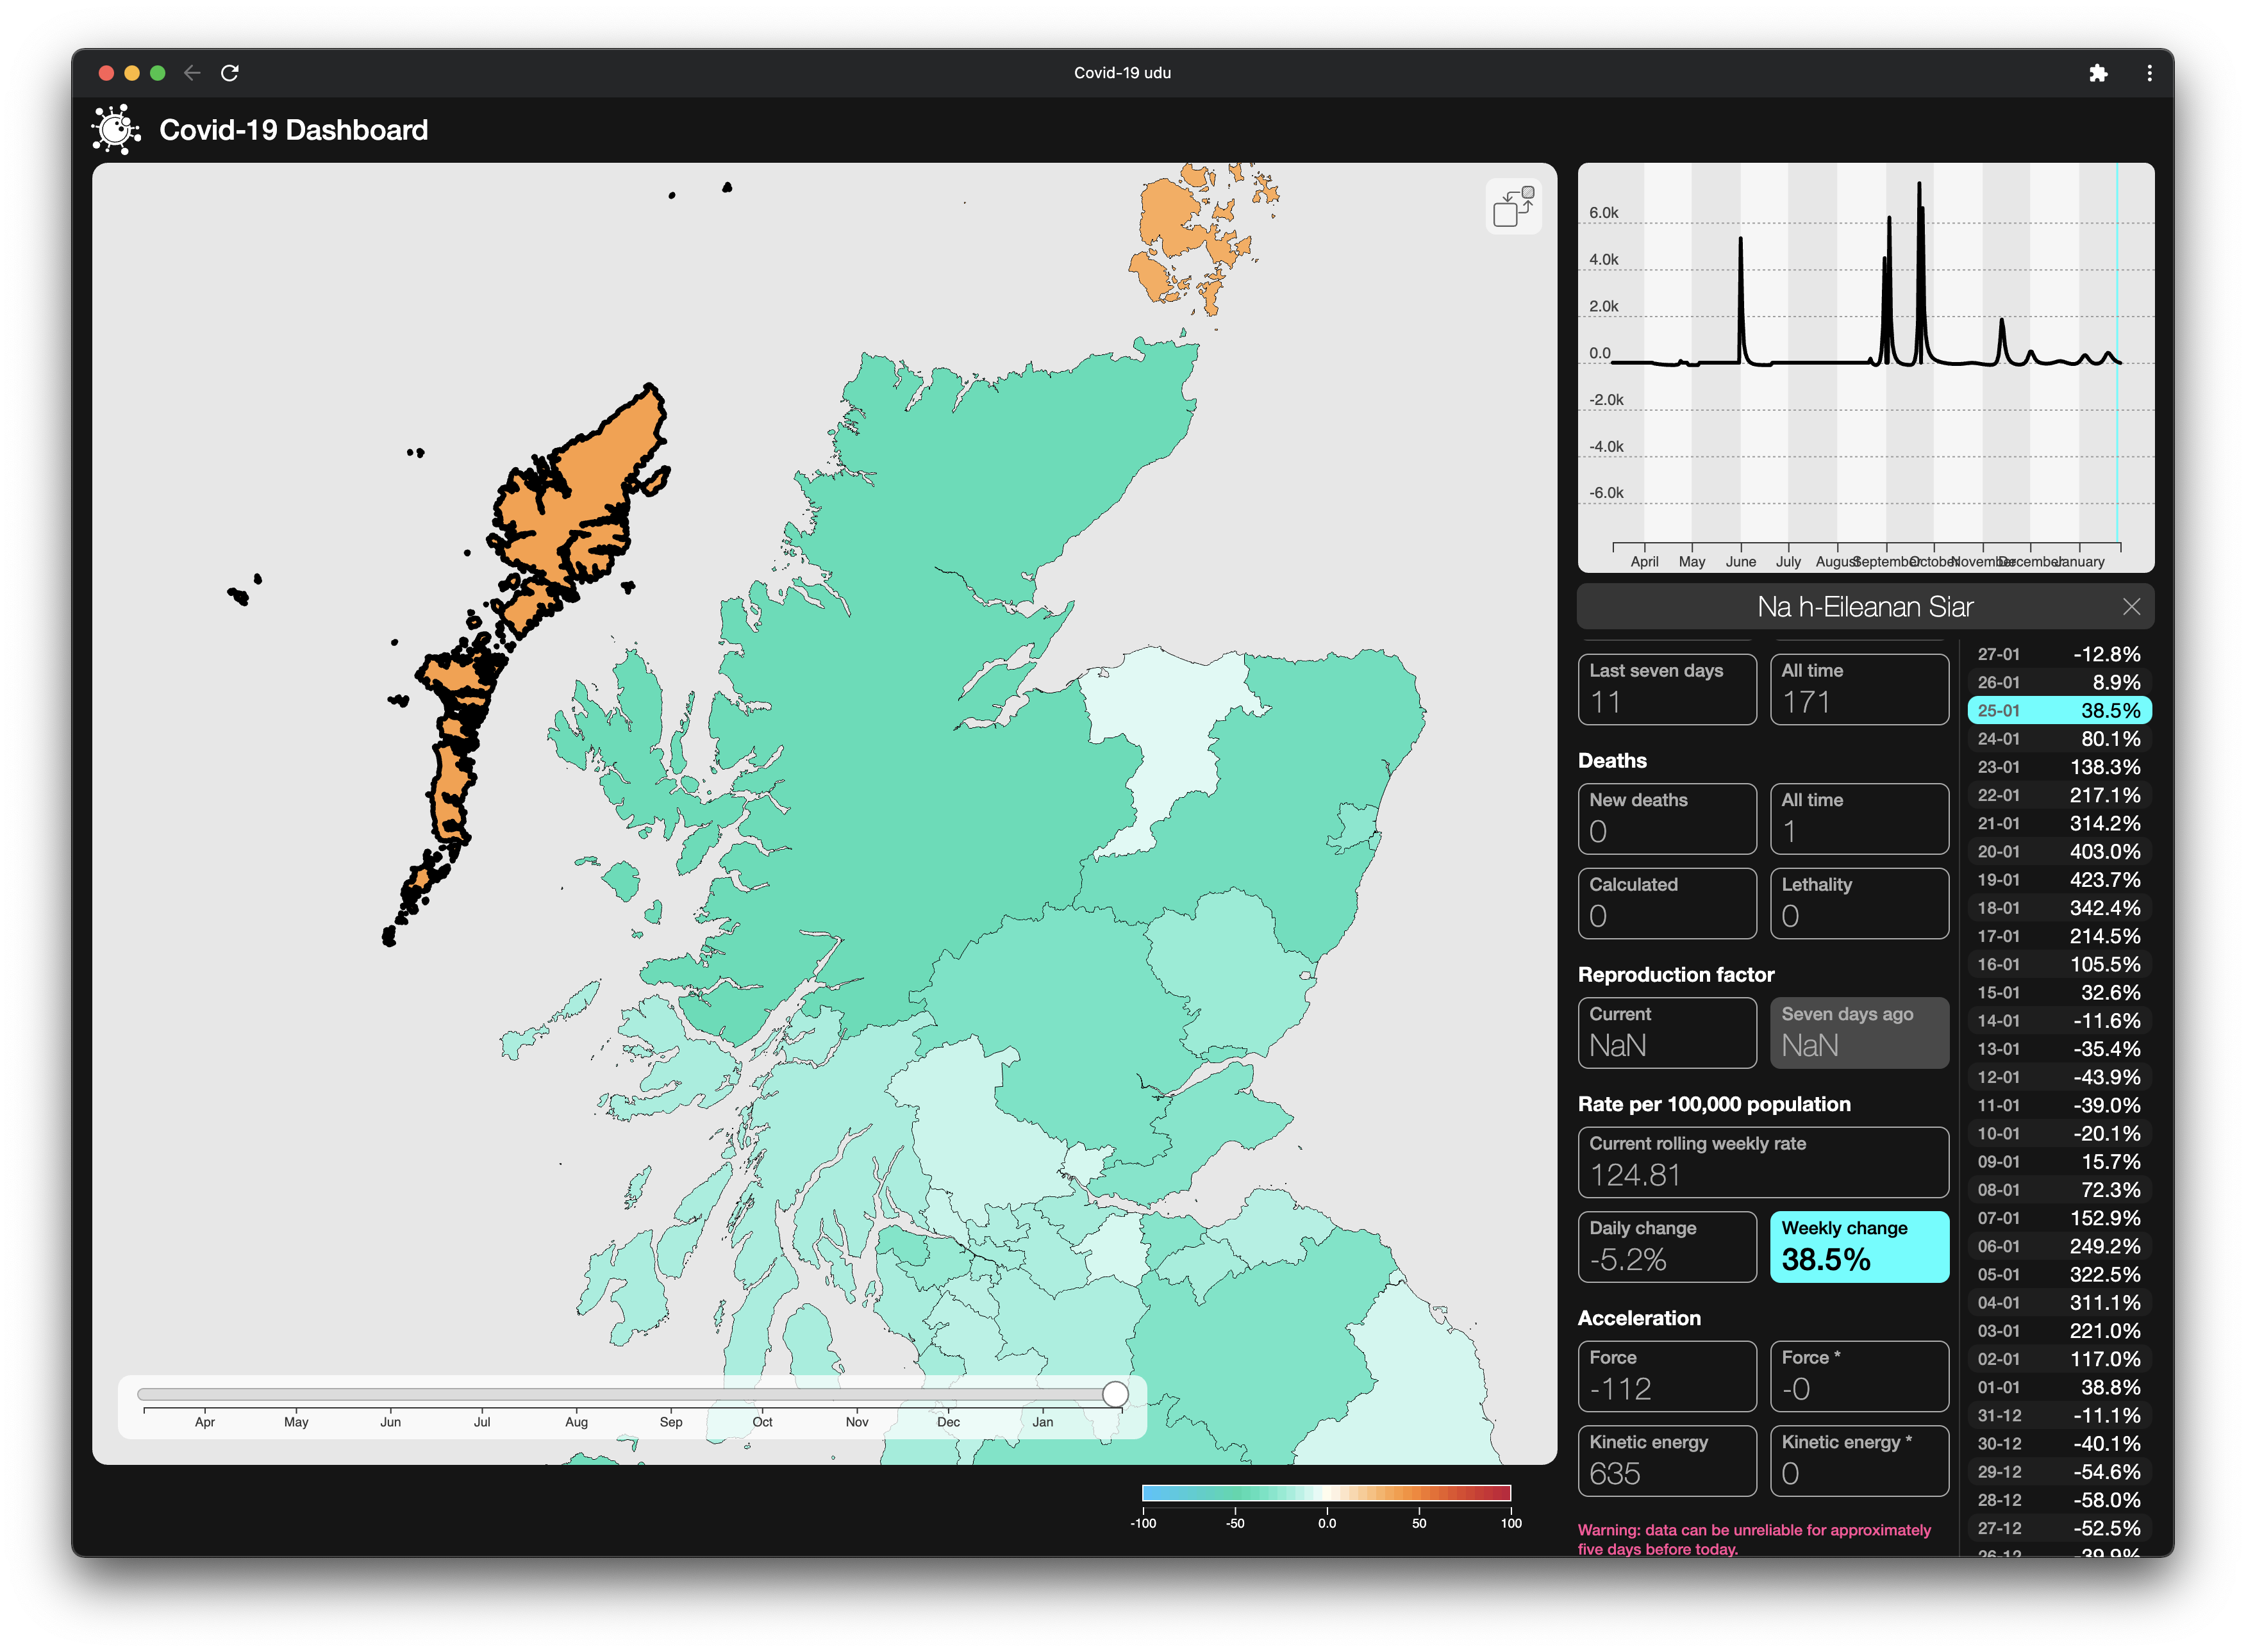
Both the raw and our compensated figures do show that the number of daily new cases relative to a week previously has been falling each day since the 25th January.
The last date for which we (just) had sufficient data to calculate the R Factor was 23rd January, when we show it at 1.01, only just on the increasing side of the equation, and it appears to have dropped since.

Our weekly rolling case rate per 100k population for the 25th January comes out at 115 – higher than for Highland, but lower than (for instance) North Lanarkshire (284) and the City of Glasgow (274). That number is, in turn, 21% down on the previous week.


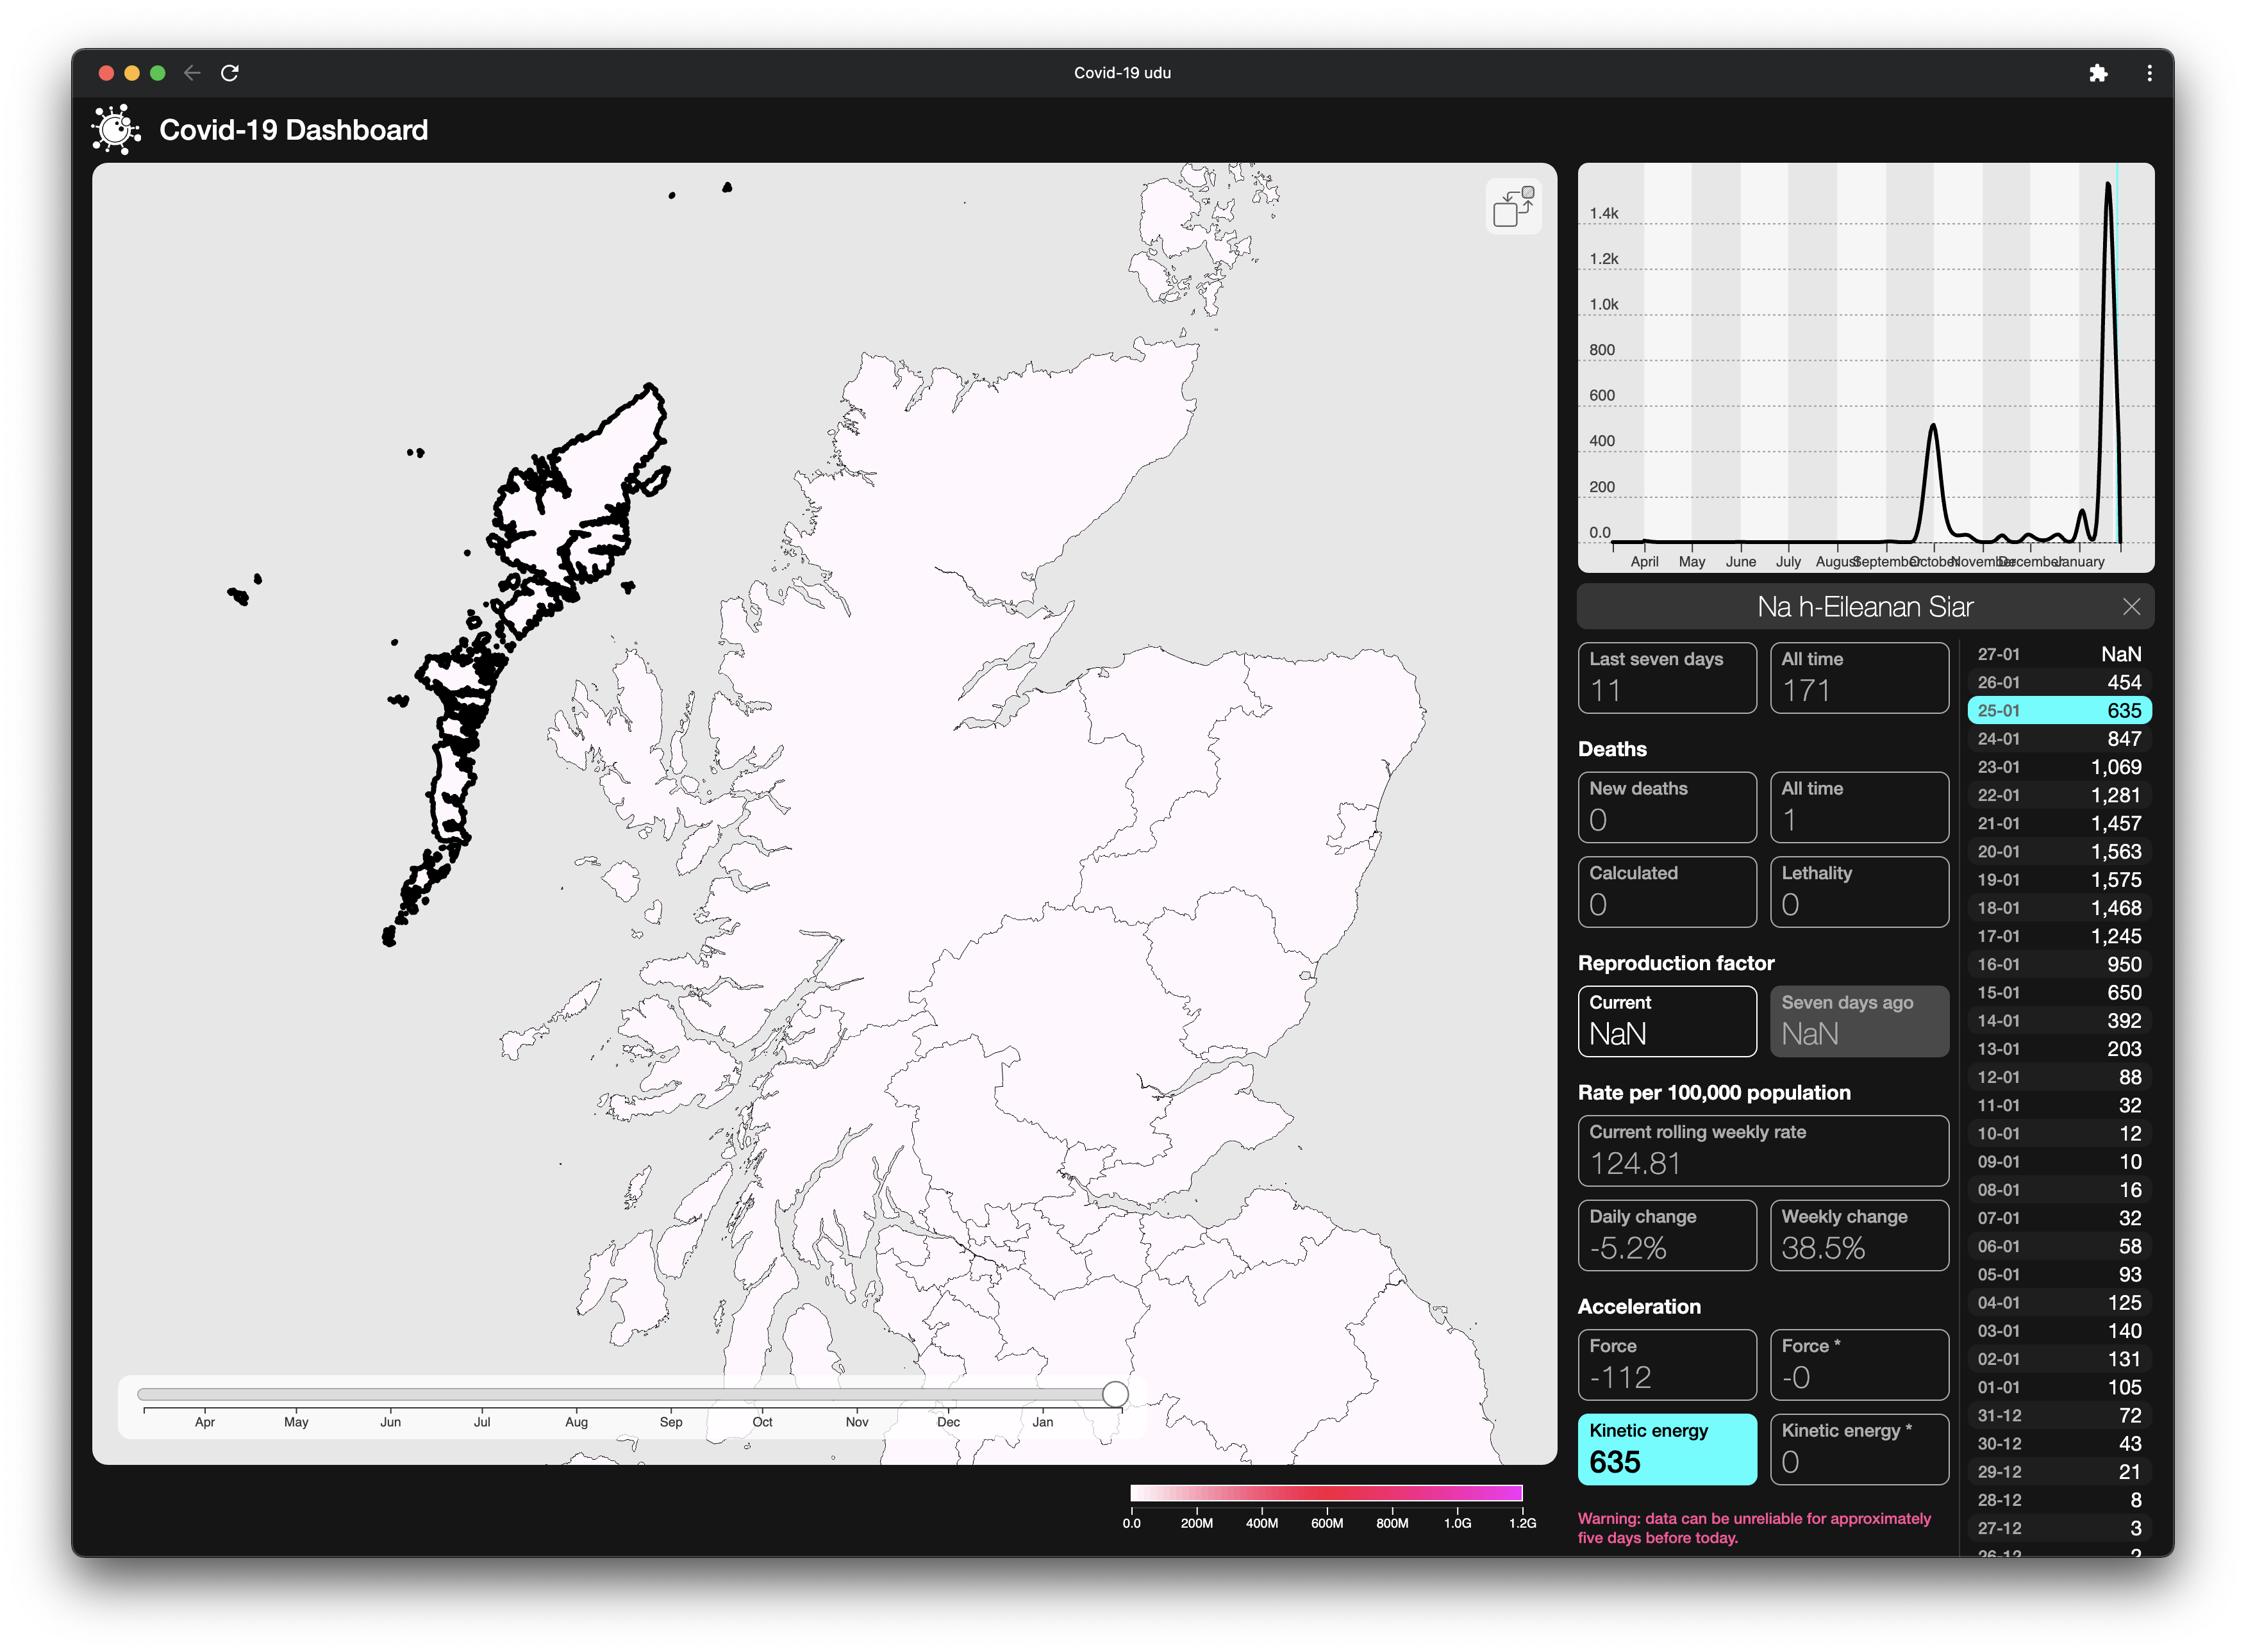
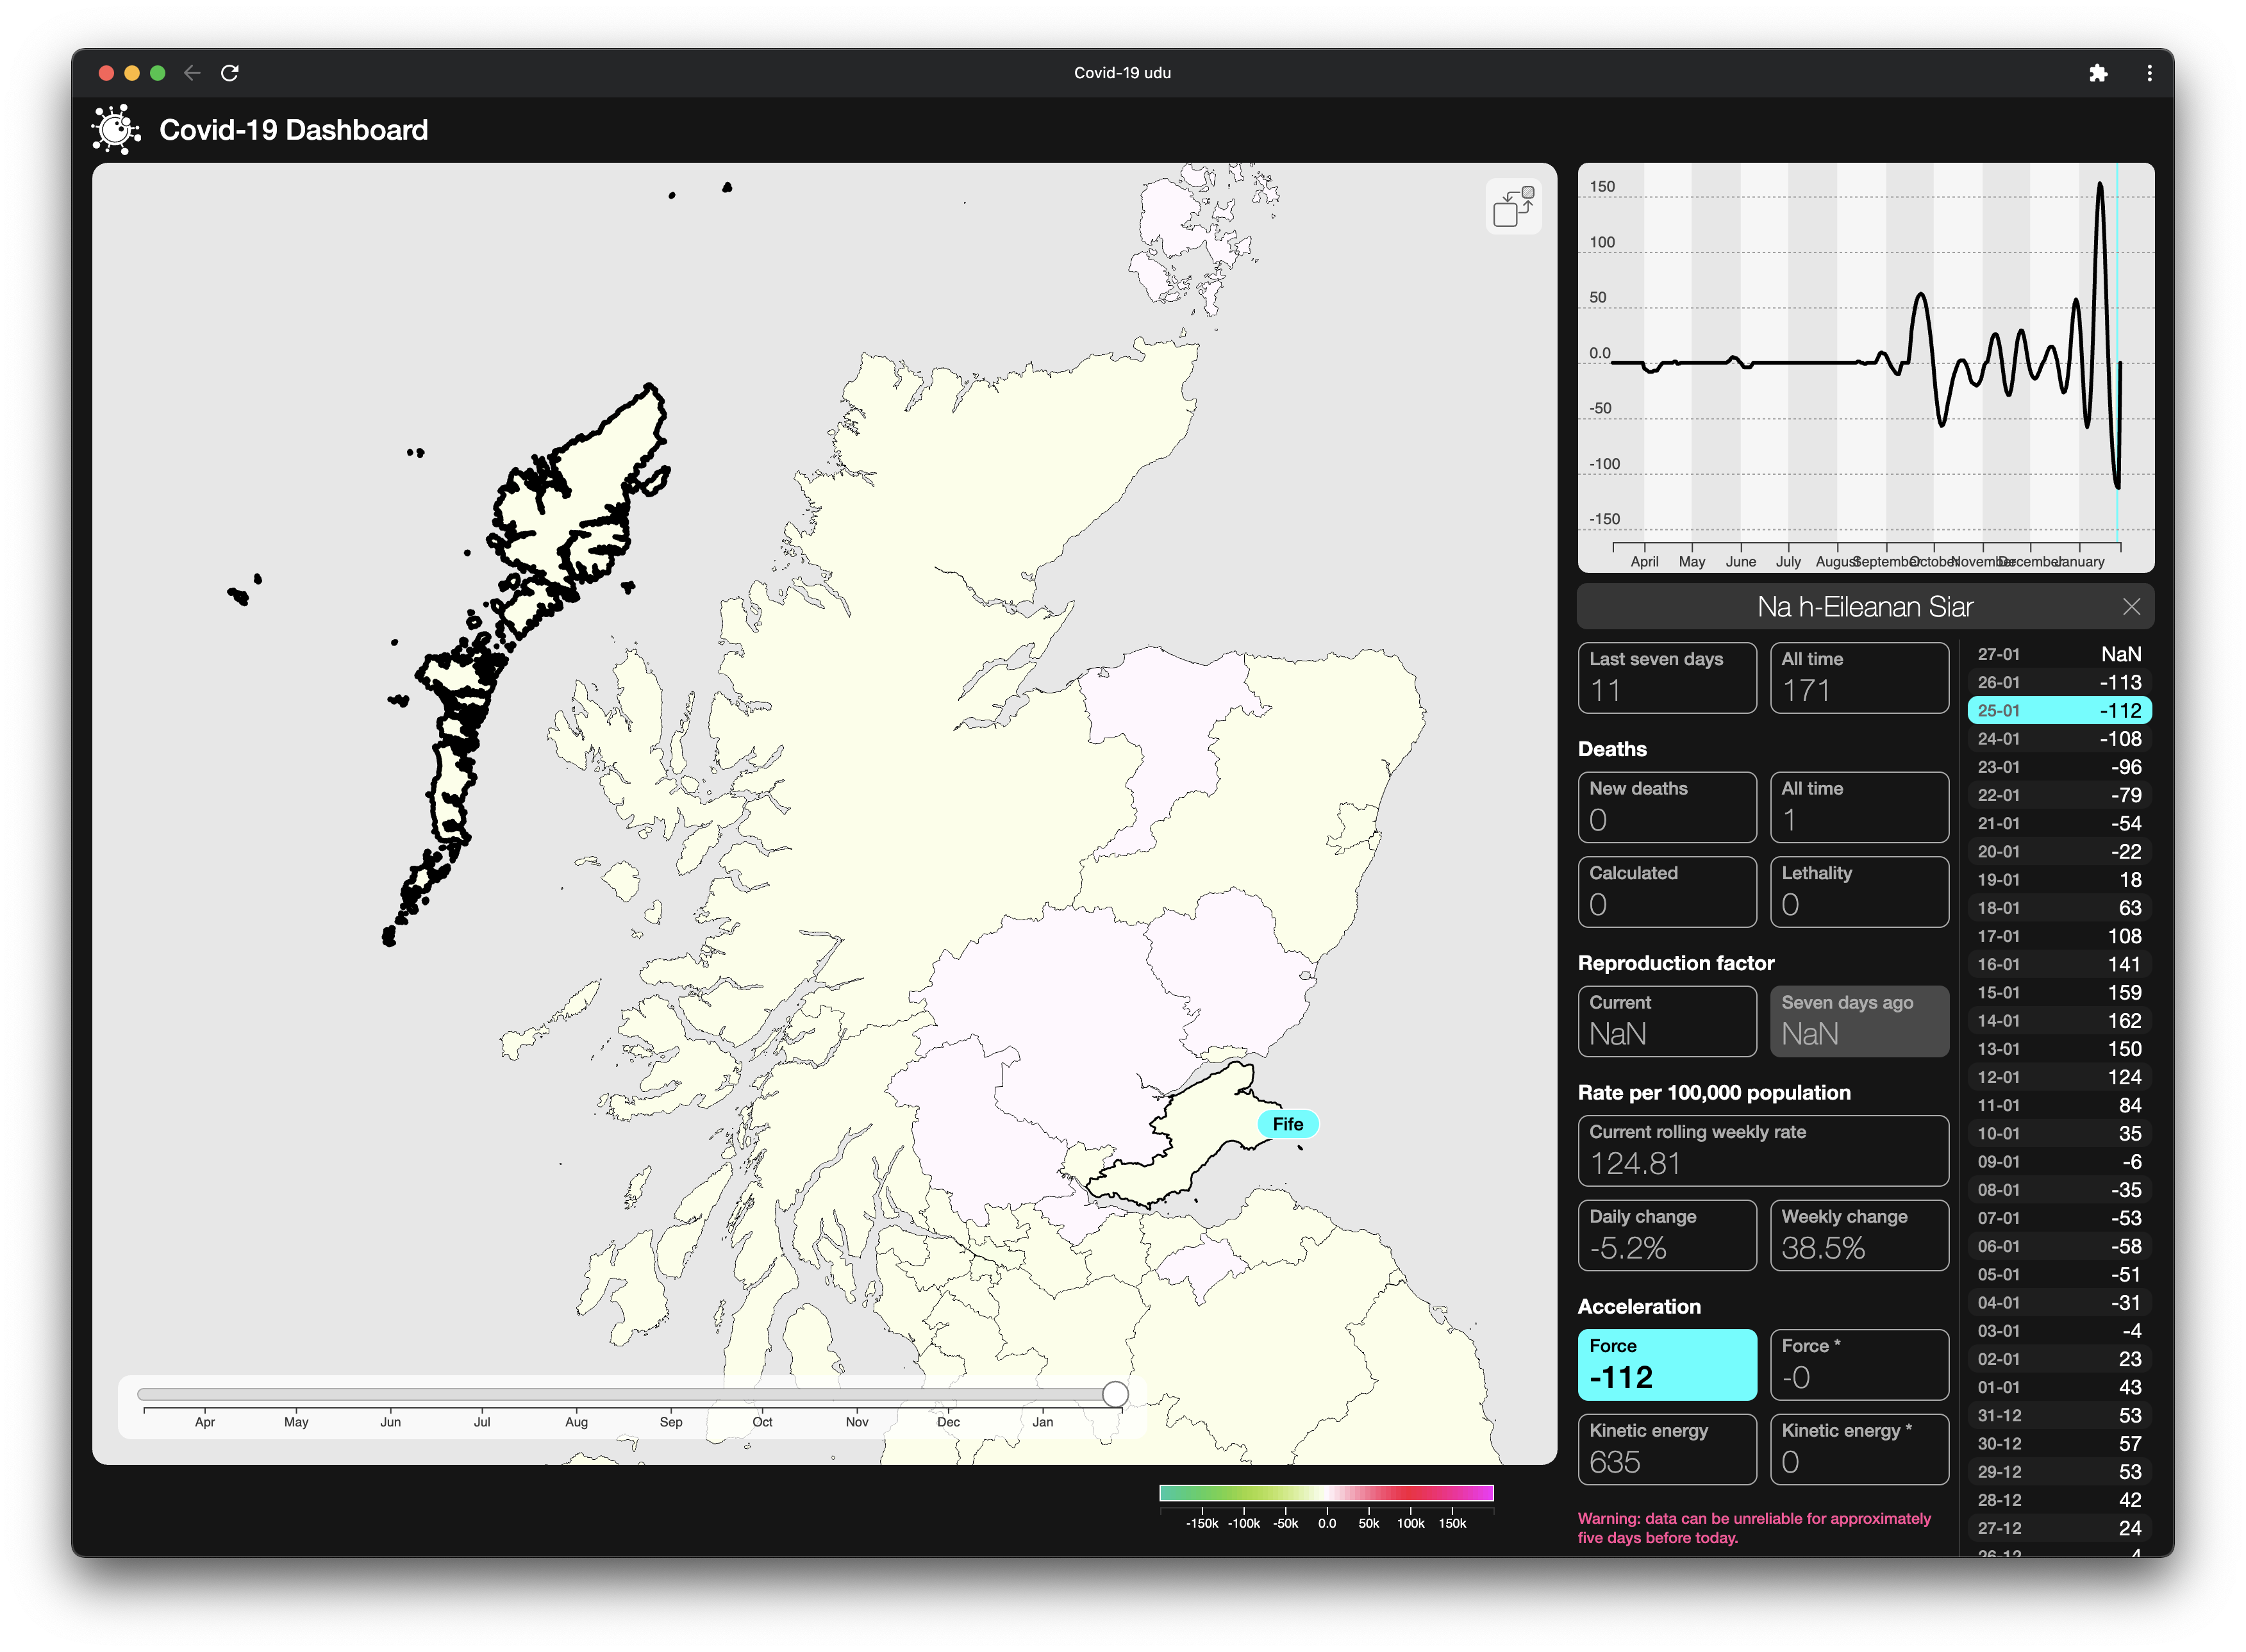
Our kinetic modelling then shows that the pandemic in Na h-Eileanan Siar has been decelerating since the 19th January and that the pandemic\’s momentum in the area is only 25% of what it was at its peak, also on 19th January.


Our 28-day predictive model doesn\’t return a statistically valid projection for Na h-Eileanan Siar, simply because the actual case numbers are too low for confidence.
Conclusions
From the data we have, and the model we\’ve developed, it appears that the outbreak is already past its peak in Na h-Eileanan Siar, suggesting that the time to move to a Level 4 lockdown would have been much earlier in the month, and that imposing higher restrictions in an area where the case rate is already falling significantly is unnecessary.
From the public statements, it appears that pressure hospital capacity was a key factor in the lockdown decision. Unfortunately, given the typical 7-10 day lag from a positive test to admission, and an average 13-14 day lag from onset to death, we\’re only now seeing the peak admissions from the period of 18-24 January, since when the energy of the pandemic in Na h-Eileanan Siar has halved.
For a Level 4 to have helped, it would have been appropriate when the pandemic first started to accelerate around 10-11 January. In fact there was an argument for taking action during the previous \’bump\’, from 28th December. And this is where both near real time analytics and improved predictive modelling can help with policy decisions, albeit that, in this case, the numbers simply aren\’t robust enough to allow for effective projections to be made.
Caveat: We are working from daily published figures from Public Health Scotland and from the UK government\’s data API, and the Scottish Government may well have access to other figures that are not yet being published .
Development of Two Worlds’ adaptive analytic platform for the Covid-19 pandemic is supported by InnovateUK under R&D grants 54368 and 93341.


Pingback: Building a Better Crystal Ball | Two Worlds: Intelligent Reality
Pingback: Proving a Point? | Two Worlds: Intelligent Reality