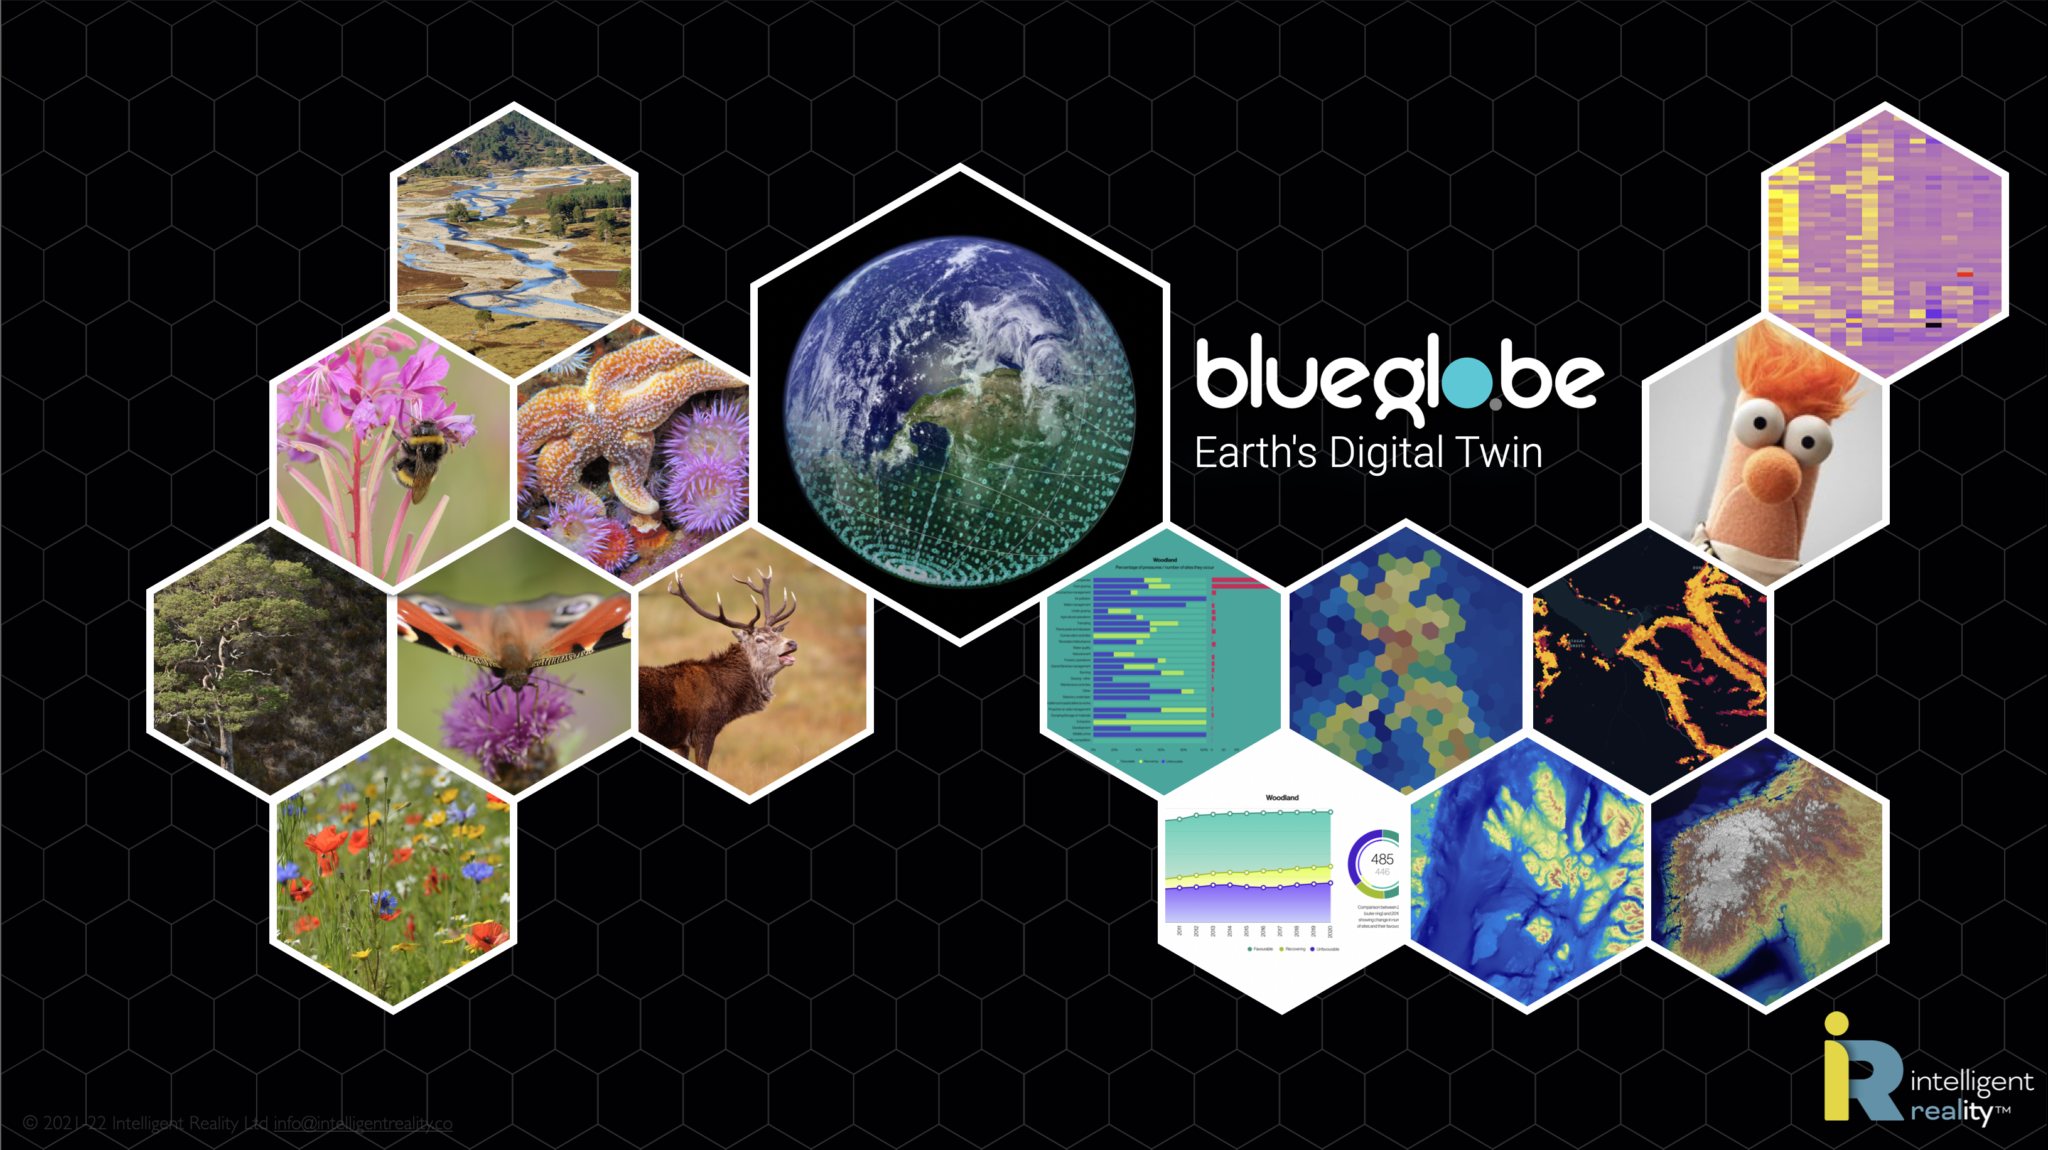
Our geospatial data intelligence platform, BlueGlobe, provides a common framework for the exploration, analysis and presentation of any geospatial data. By mapping a huge variety of data sources into a consistent mathematical model, it means that it can dynamically discover patterns, trends, similarities and differences for any part of the landscape, however defined.
We use a variety of statistical and machine learning-based techniques for discovery and analysis, and have applied this approach very successfully in a range of applications, including:
- identifying and forecasting Covid-19 demographic trends, case numbers and pandemic dynamics, calculated daily, from country to local authority levels. Here, we used hindcasting to demonstrate in excess of 70% accuracy (calculated as being within data error limits) to 28 days ahead and in excess of 80% to 14 days.
- creating dynamic clustering that looks for similarities and differences across the landscape, integrating everything from protected site and species data to social demographics, travel patterns and earth observation data
- discovery of candidate temperate rain forest areas in Scotland, beyond those already known and mapped
- identification and forecasting of blue-green algal blooms in Scottish lochs, providing both status reports and forecast alerts for water sports and animal owners
- water quality monitoring and forecasting in estuarine environments (we were using the Forth basin as a test case.
We’ll be posting and publishing a range of case studies, as time permits, for these specific applications and for a range of generic features of BlueGlobe. In each case, even with limited early-stage data sets, we have been able to generate meaningful results after creating appropriate analytic elements, after which exploration and discovery happens in near real time. The analytic elements themselves become modules within our forthcoming public system, allowing non-experts to mix-and-match their own discovery and forecasting.

