This presentation provides a summary of our approach to unified geospatial data intelligence and what differentiates it from current practice in the integration, exploration and use of geospatial data. It was originally given at the 2024 AGI Scotland Conference.
For context, this is a quote from an IDC report in 2021. By then though, we’d already been working for several years on that exact challenge: taking the long-established idea of integrated business intelligence – mashing up disparate corporate data sources into a single point of interrogation – and applying it to geospatial data. But to examine the difference that makes, I’ll start with the basic needs…
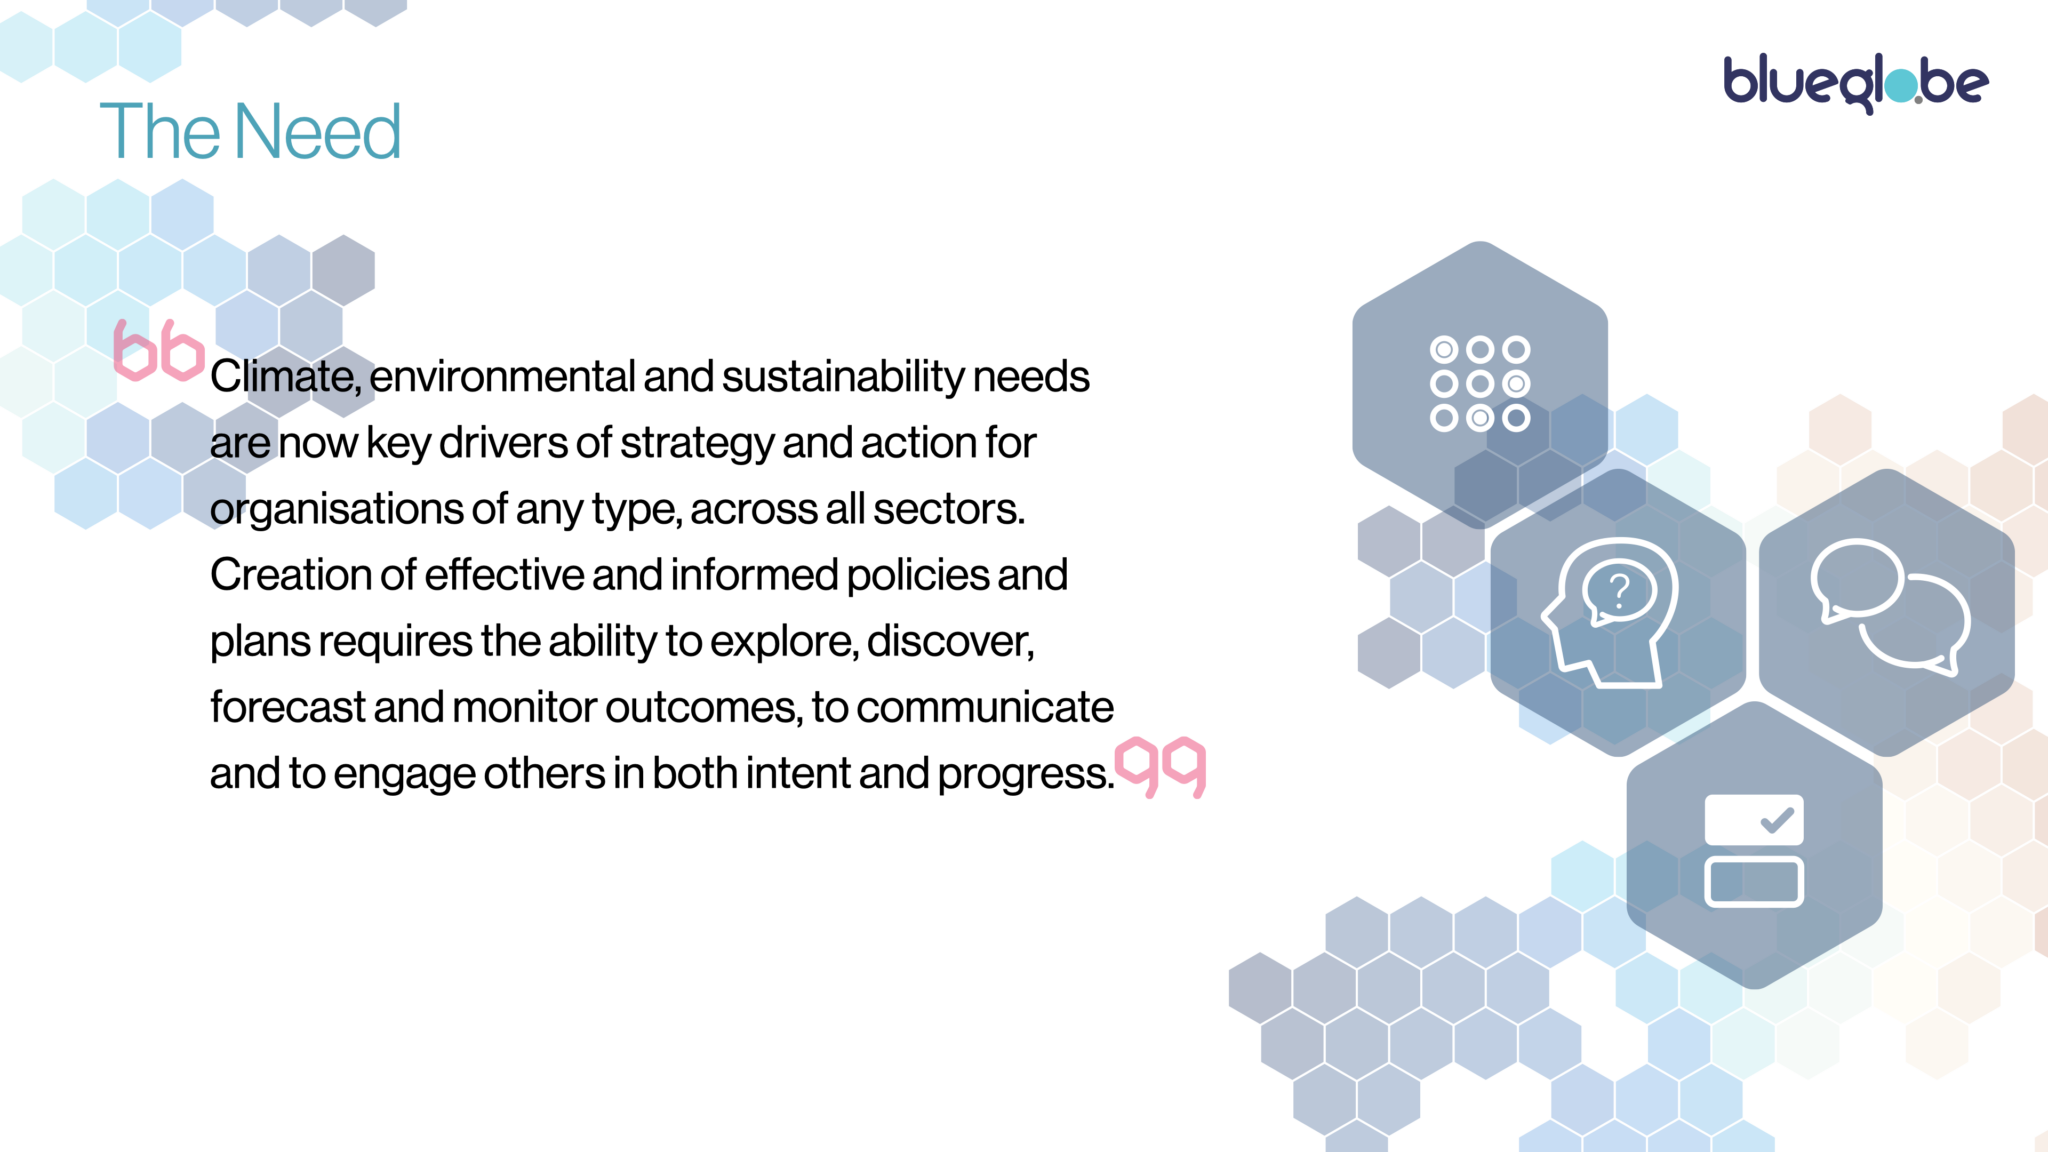
Our natural, built and human environments are complex, messy and continually changing. Any intervention we make requires us to use our best judgement to make decisions from the information available, and from our ability to integrate and comprehend that information.
That’s always been the case, but now we face the intertwined and accelerating existential challenges of climate change and environmental degradation. And we’ve also just staggered through a major crisis, Covid-19, which itself can be regarded as a rehearsal for more to come.
Here, recovery, mitigation, adaptation and resilience building requires every constituency of society: governments, public agencies, enterprises and individual communities, to be able to make and refine effective and informed decisions against robust forecasting.
That however only works when we can rapidly explore and assimilate the current state of an area and its diverse attributes, and are able to see how it compares to other areas – either in terms of the differences between otherwise similar areas or through the discovery of comparable areas, based on whatever metrics we choose to use. And of course we need to do so at levels from the supranational to the hyperlocal.
We then need to track trends, forecast the impact of different potential interventions and – particularly – capture feedback from actual outcomes over time, to allow us to refine and continue the decision-making cycle.
The big picture though is the need to weave a dynamic tapestry from trends, societal need and actions – from forecasting and tracking individual developments to wider environmental and socioeconomic initiatives. We also need to be able to rapidly formulate informed responses to crises such as Covid and natural disasters.
So we need to be able to look at everything from local site management, the development of planning policy frameworks or ecosystem monitoring tools, through to strategic initiatives such as Net Zero, Natural Capital assessment and tracking, Nature Networks, 30×30, ESG policies and 15 minute cities. We also need to do so by implementing common standards into our model and applications, as these emerge.
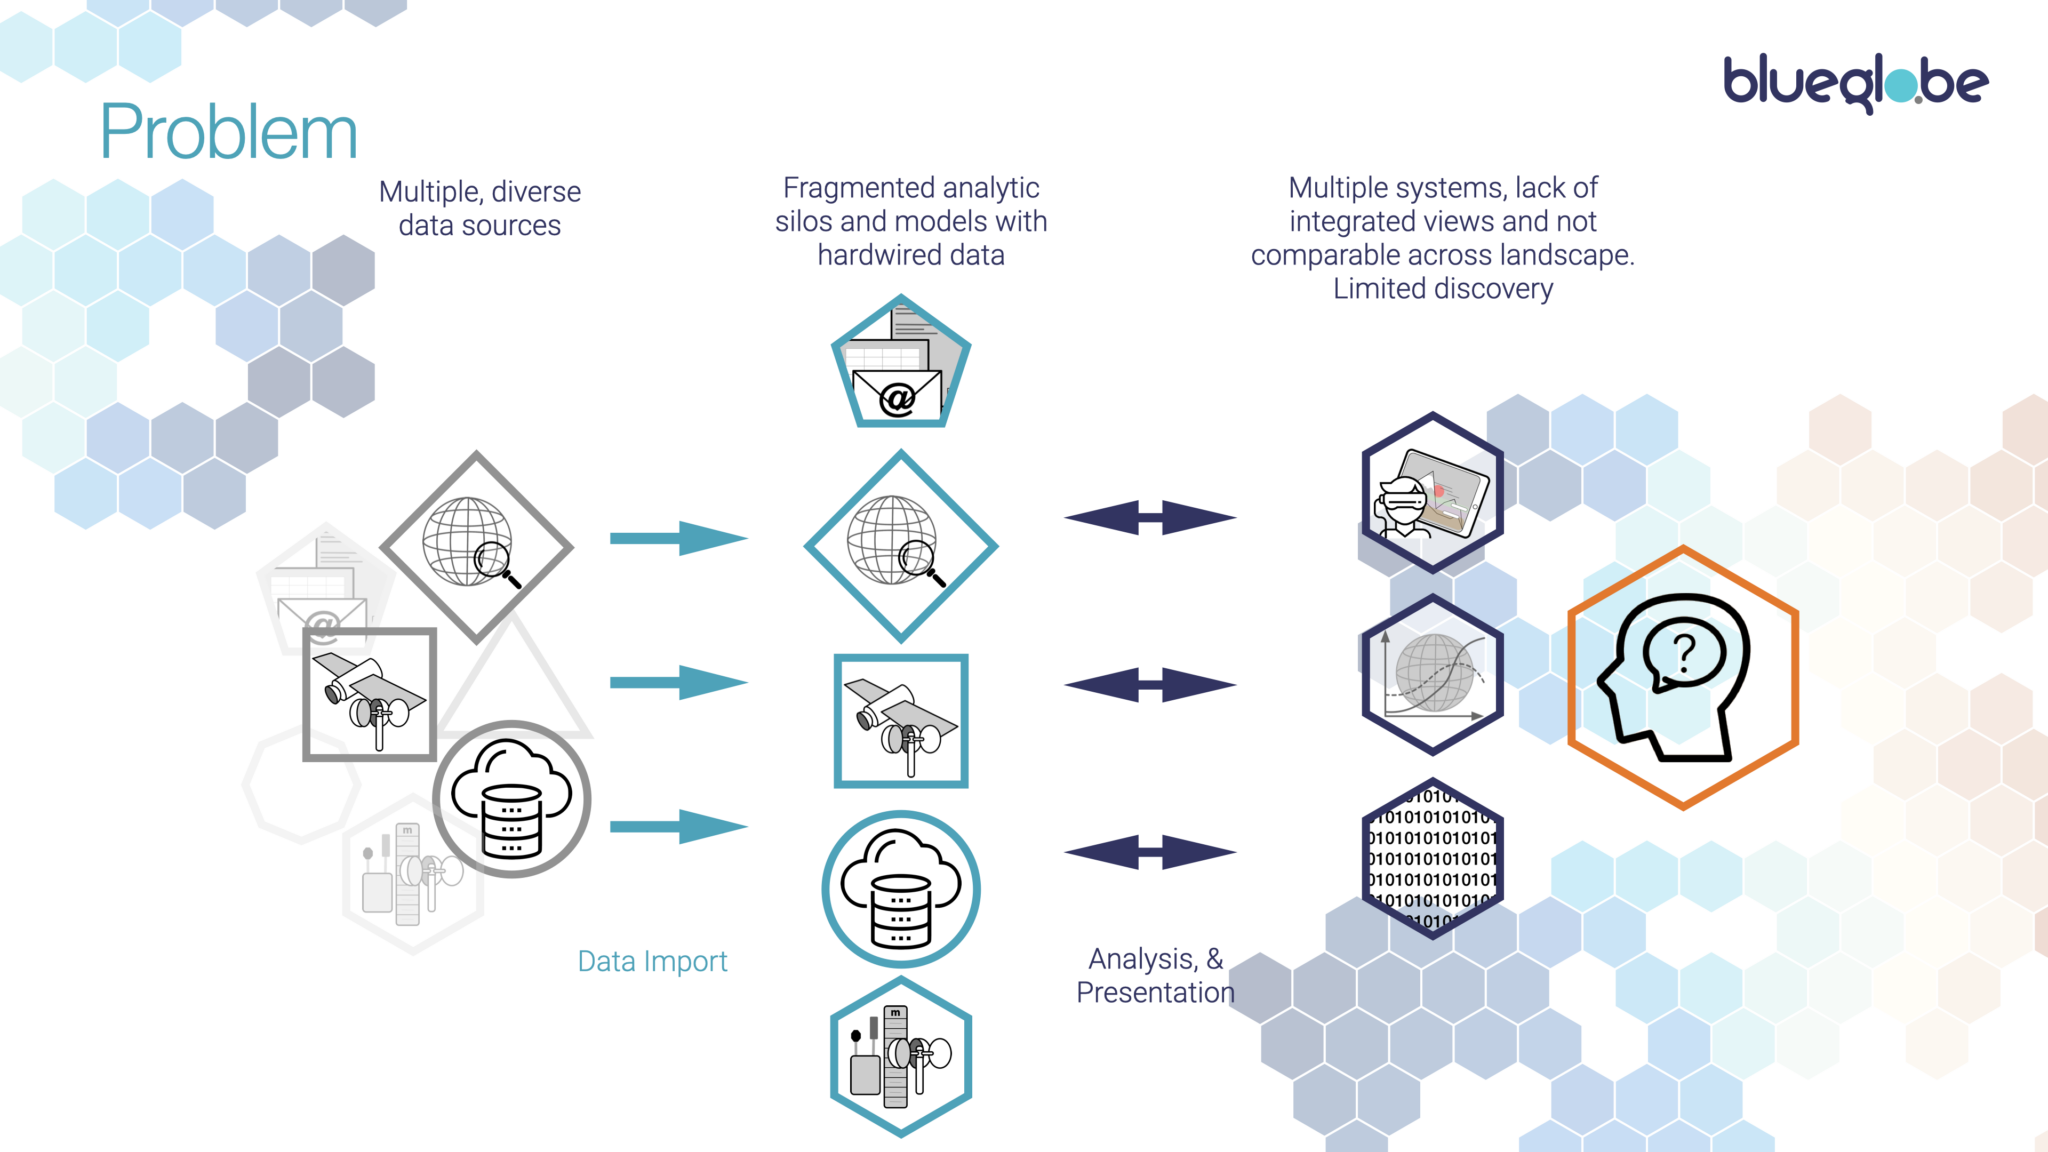
And that’s where we have a problem:
There’s a long-standing industry trope that 80% of data has at least some geospatial relevance.
That’s plausible, but it comes from diverse and fragmented sources and in a huge range of formats and co-ordinate systems: satellite data, sensor streams, GIS, survey reports, drone imagery, demographic data sets and mapping systems just for starters. Then you get the valuable information that’s tied up in narrative data, from which you need to extract and contextualise relevance.
Data also tends to remain, and to be used within, those source silos – creating an holistic view from different data classes captured in different ways and for different areas, is an expensive, time-consuming and largely manual process, which requires specialist skills.
It often doesn’t happen, for exactly those reasons and, consequently, decisions are often either outsourced into box-checking and often ineffective – or even counterproductive – actions, or significant policy decisions end up being made from partial data, flawed assumptions or simply wishful thinking.
The scarcity of relevant skills and resources also means that many organisations and local initiatives are entirely unable to access the data and analytics required to support their intent and initiatives.
Whatever the issue, you usually end up with confused human beings at the end of the chain, trying desperately to wrangle all these partial results from different systems into a coherent whole.
It doesn’t have to be like that.
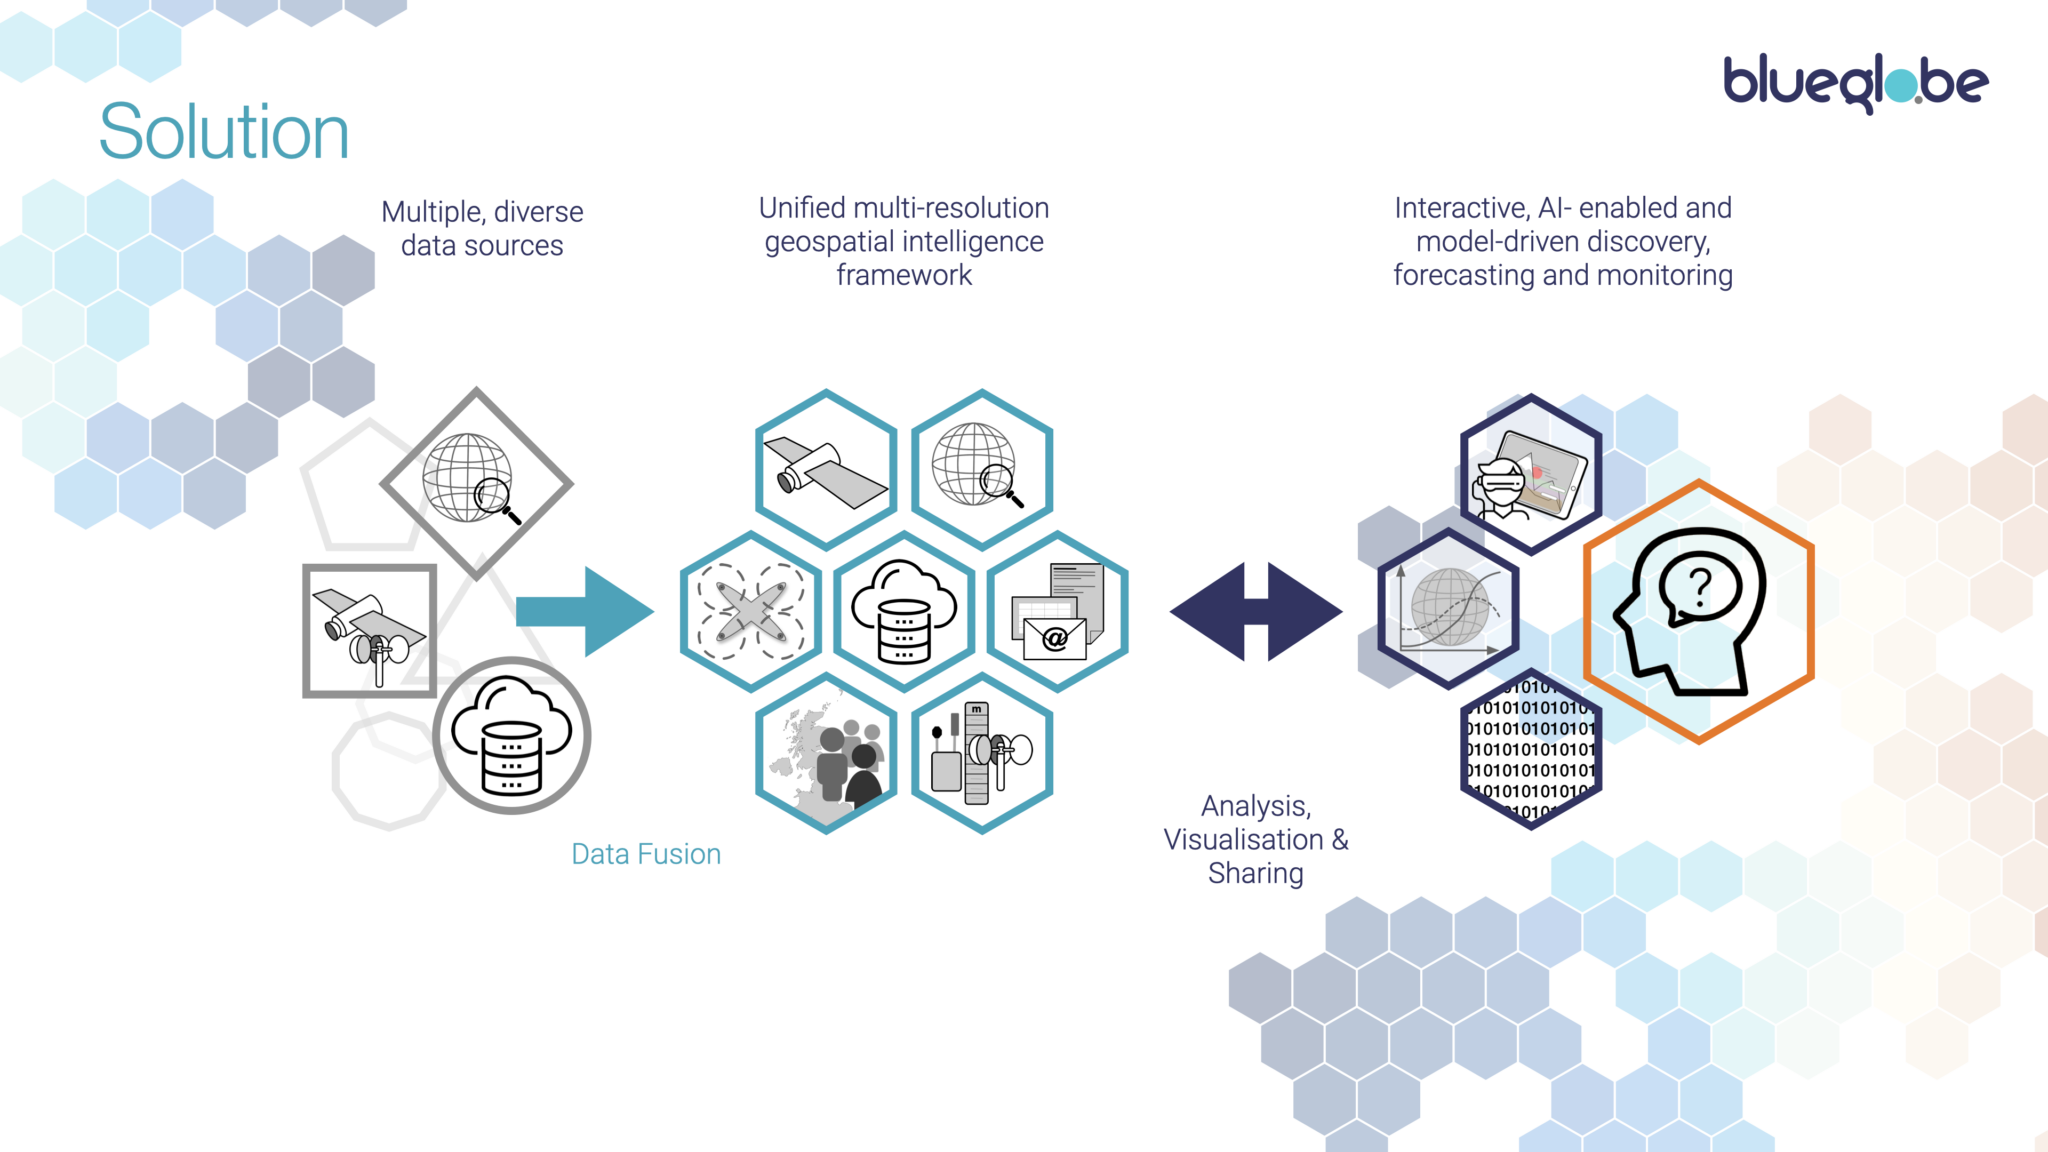
There are a number of services and projects that seek to address these problems.
Our solution is BlueGlobe, geospatial data intelligence software based on a tiled, multi-resolution simulation of Earth – a ‘Digital Twin’ of our planet. It sits atop existing systems and transforms their diverse data classes and sources into a unifying computational framework, to offer a pre-populated model, from which we can drive a wide range of general and sector-specific applications, enabling discovery and modelling that was hitherto impracticable, reducing action time from days-to-months to seconds-to-hours.
BlueGlobe’s computational framework includes H3, an open source (and de facto standard) derived from a model created by mathematician John Conway in the 1970s – anyone with a background in evolutionary biology or AI will recognise him as the creator of the ‘Conway’s Game of Life‘ simulation.
That model supports spatial resolutions from 4.5M km2 down to <1m2. For practical purposes, we render our model from tile resolutions from 12,000km2 to 43m2. Our basic global model plus topographic data is then some 180TB in size, before we start mapping data sets into the system, which rapidly takes us into a Petabyte scale system: it’s only in the last few years that such an approach has become practicable. We started with a focus on Scotland, for which we have 200+ data sets mapped into 4.7Bn tiles, down to 40m2 resolution for some data. That framework is populated by an ever-expanding range of intelligent importers, creating a rich data stack or ‘honeypot’ for each tile.
The multidimensional datascape thus created drives exploration, analysis and visualisation tools. For these, we take an ensemble approach, combining ‘classical’ deterministic analysis, modelling and forecasting with the inferential and generative capabilities of modern AI. We carry out validation, feature and time series extraction from the data, and those outputs then feed both statistical and AI-based analysis and forecasting. Combining the two provides for the highest quality of confidence and assurance that can be extracted from the available data and helps identify conflicts between different data sets. A key point there is that our data framework is application agnostic: we can drive any method or model without hacking the data architecture.
The framework also allows algorithmic ‘walking’ across the landscape by any combination of attributes, supporting discovery of correlations whose causality can then be investigated using hypothesis-based models.
Of course, BlueGlobe doesn’t exist in a vacuum. So we provide interfaces – APIs – to our service to enable two-way integration with data providers, external analytic and modelling tools and visualisation and presentation models.
Enough concepts, what are we doing with it?
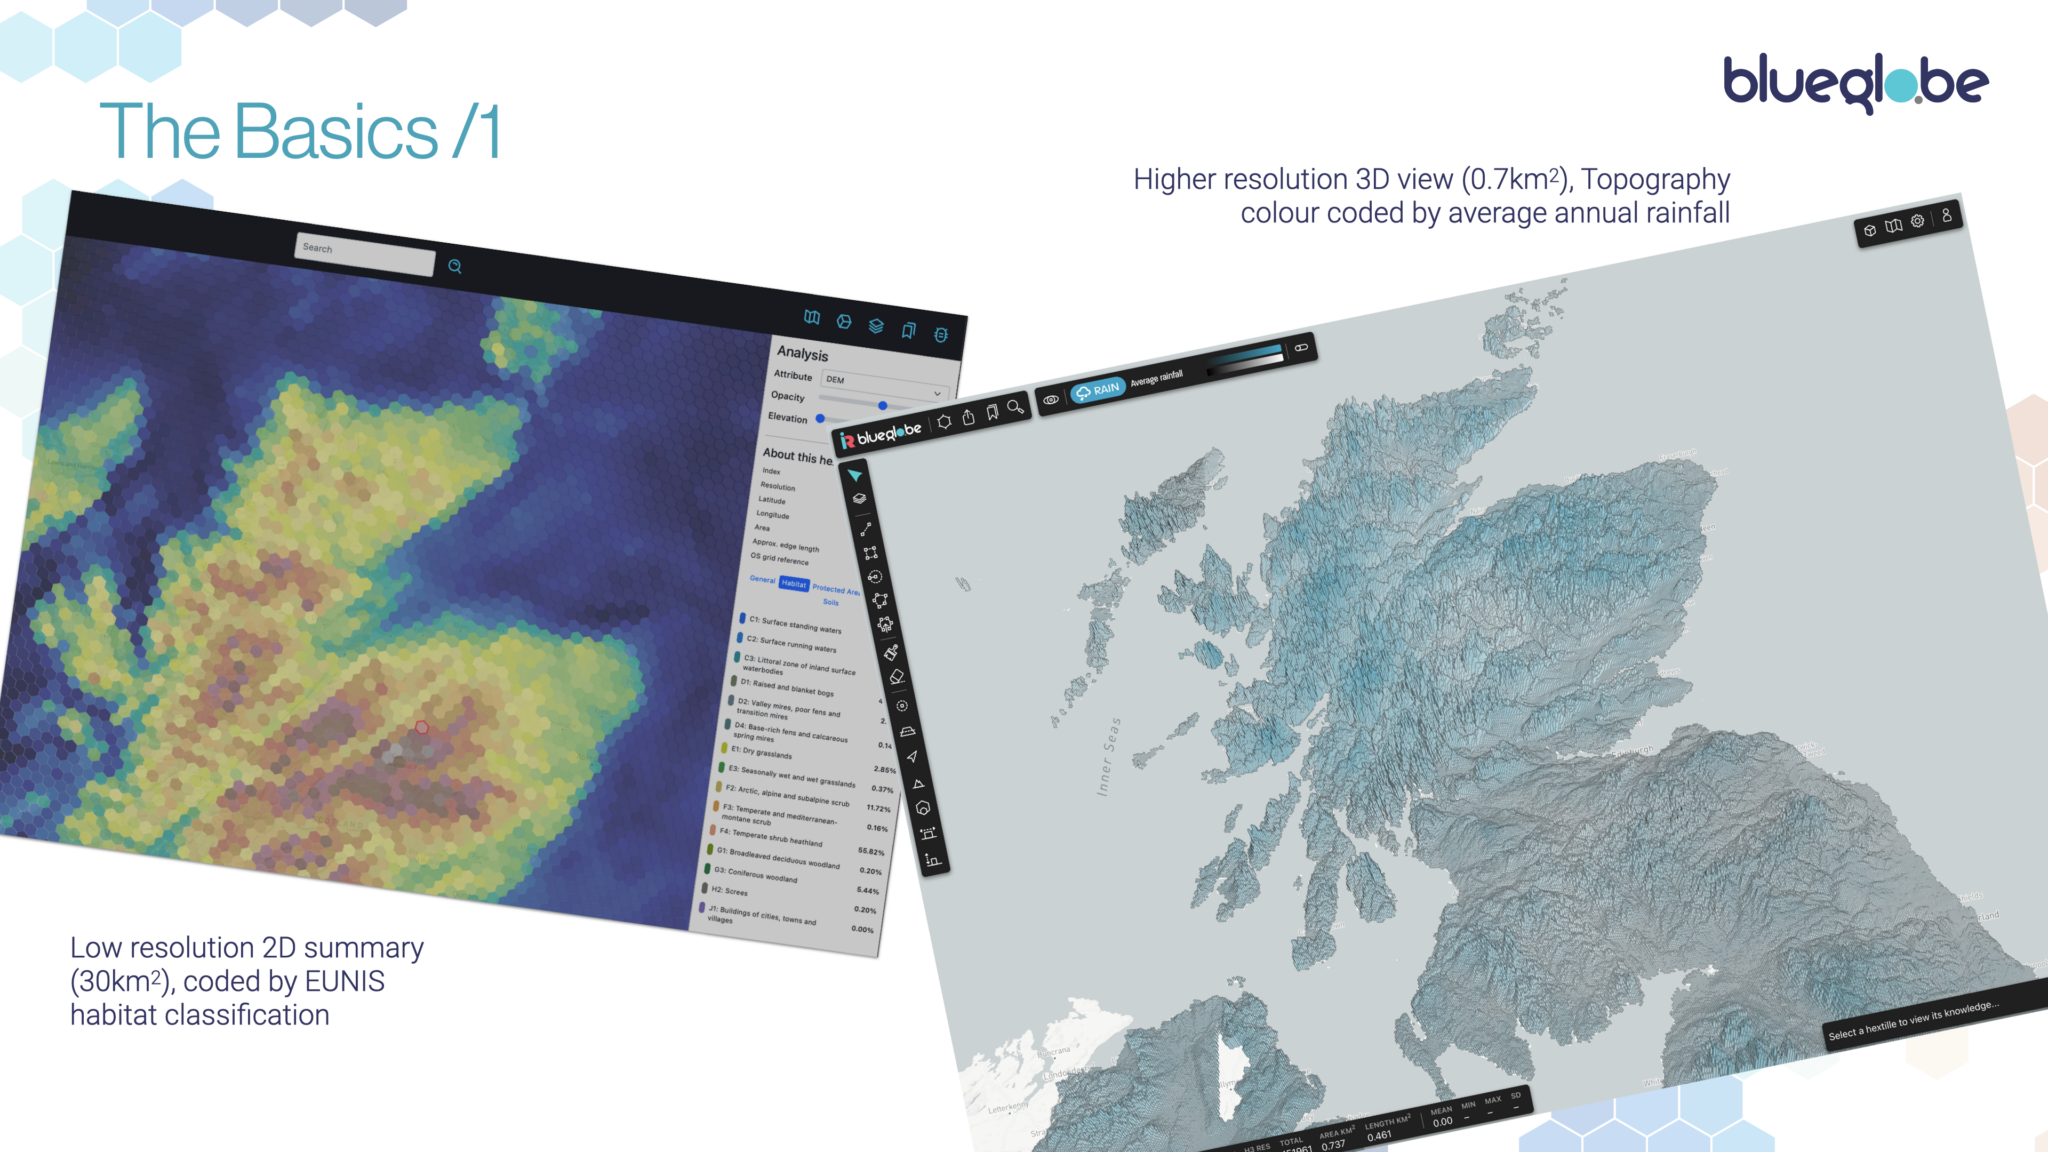
Starting with the basics, we can explore any part of the landscape, by pointing and clicking or by defining or loading existing area boundaries. We can then choose from a wide range of attributes and combine how we visualise them. Our unified data stack also allows us to refactor data between different area types – for instance, being able to take data recorded for a health authority and meaningfully refactor it for a local authority.
In this example, we start with a low resolution 2D reconstruction of northern Scotland, simply colour coded by EUNIS habitat types. At this resolution you can see the individual ‘honeypot’ data stacks for that particular resolution.
Then we move on to a higher resolution 3D view of Scotland, in this case showing its topography colour coded by average annual rainfall.
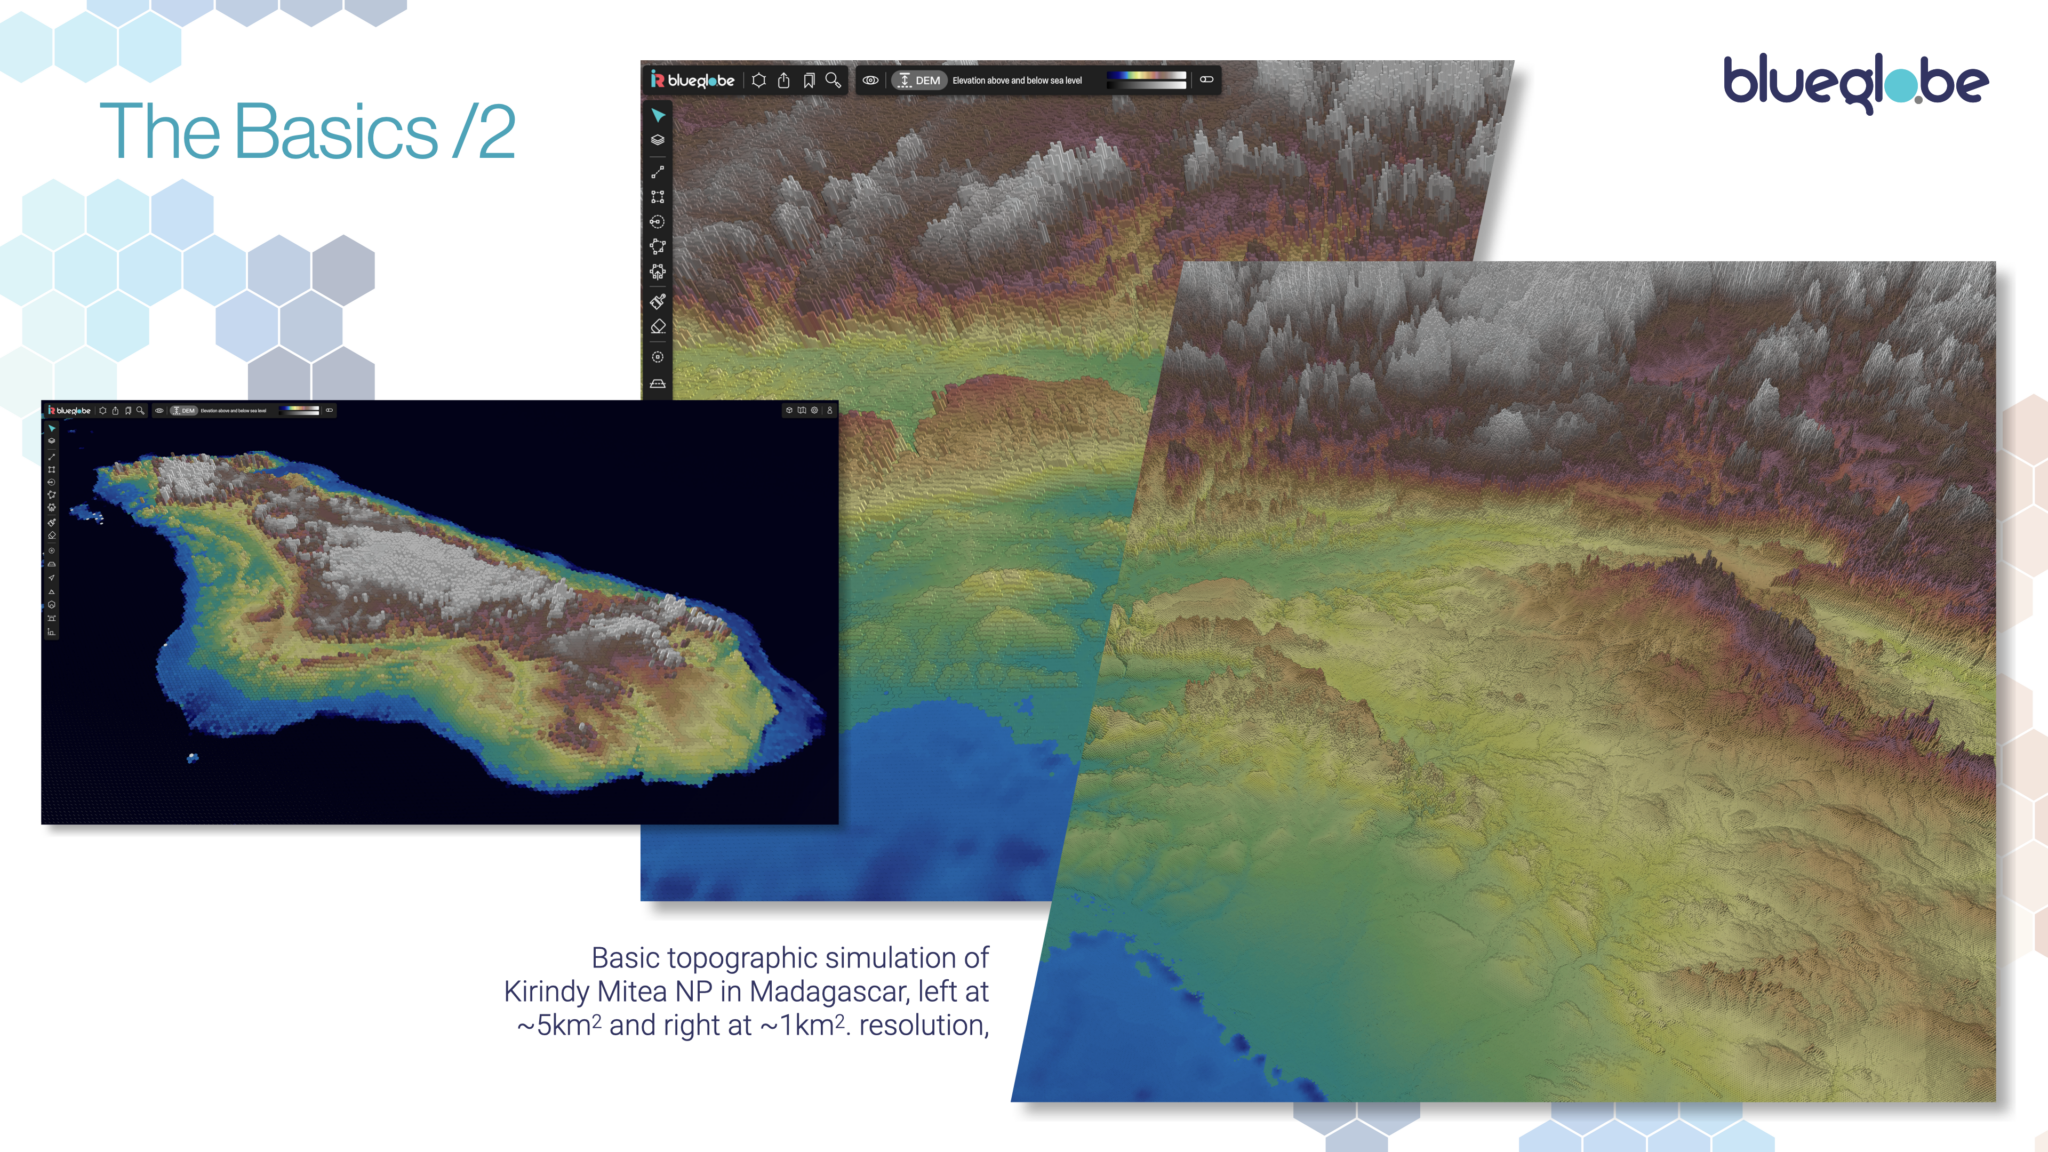
Moving further afield, this computational visualisation example shows Madagascar and then the Kirindy Mitea national park, rendered at multiple resolutions as an exaggerated Digital Elevation & Depth Map. This is navigable interactively, in real time and in 2D and 3D. It is then the starting point for biodiversity analysis and monitoring from a wide range of sources. Our core global framework is based (where possible) on the integration of a wide range of open source data sets. To those we then add national or local data sets to provide more detail for any area. Private and secure data sets then integrate with the wider framework support sector- and client-specfic applications.
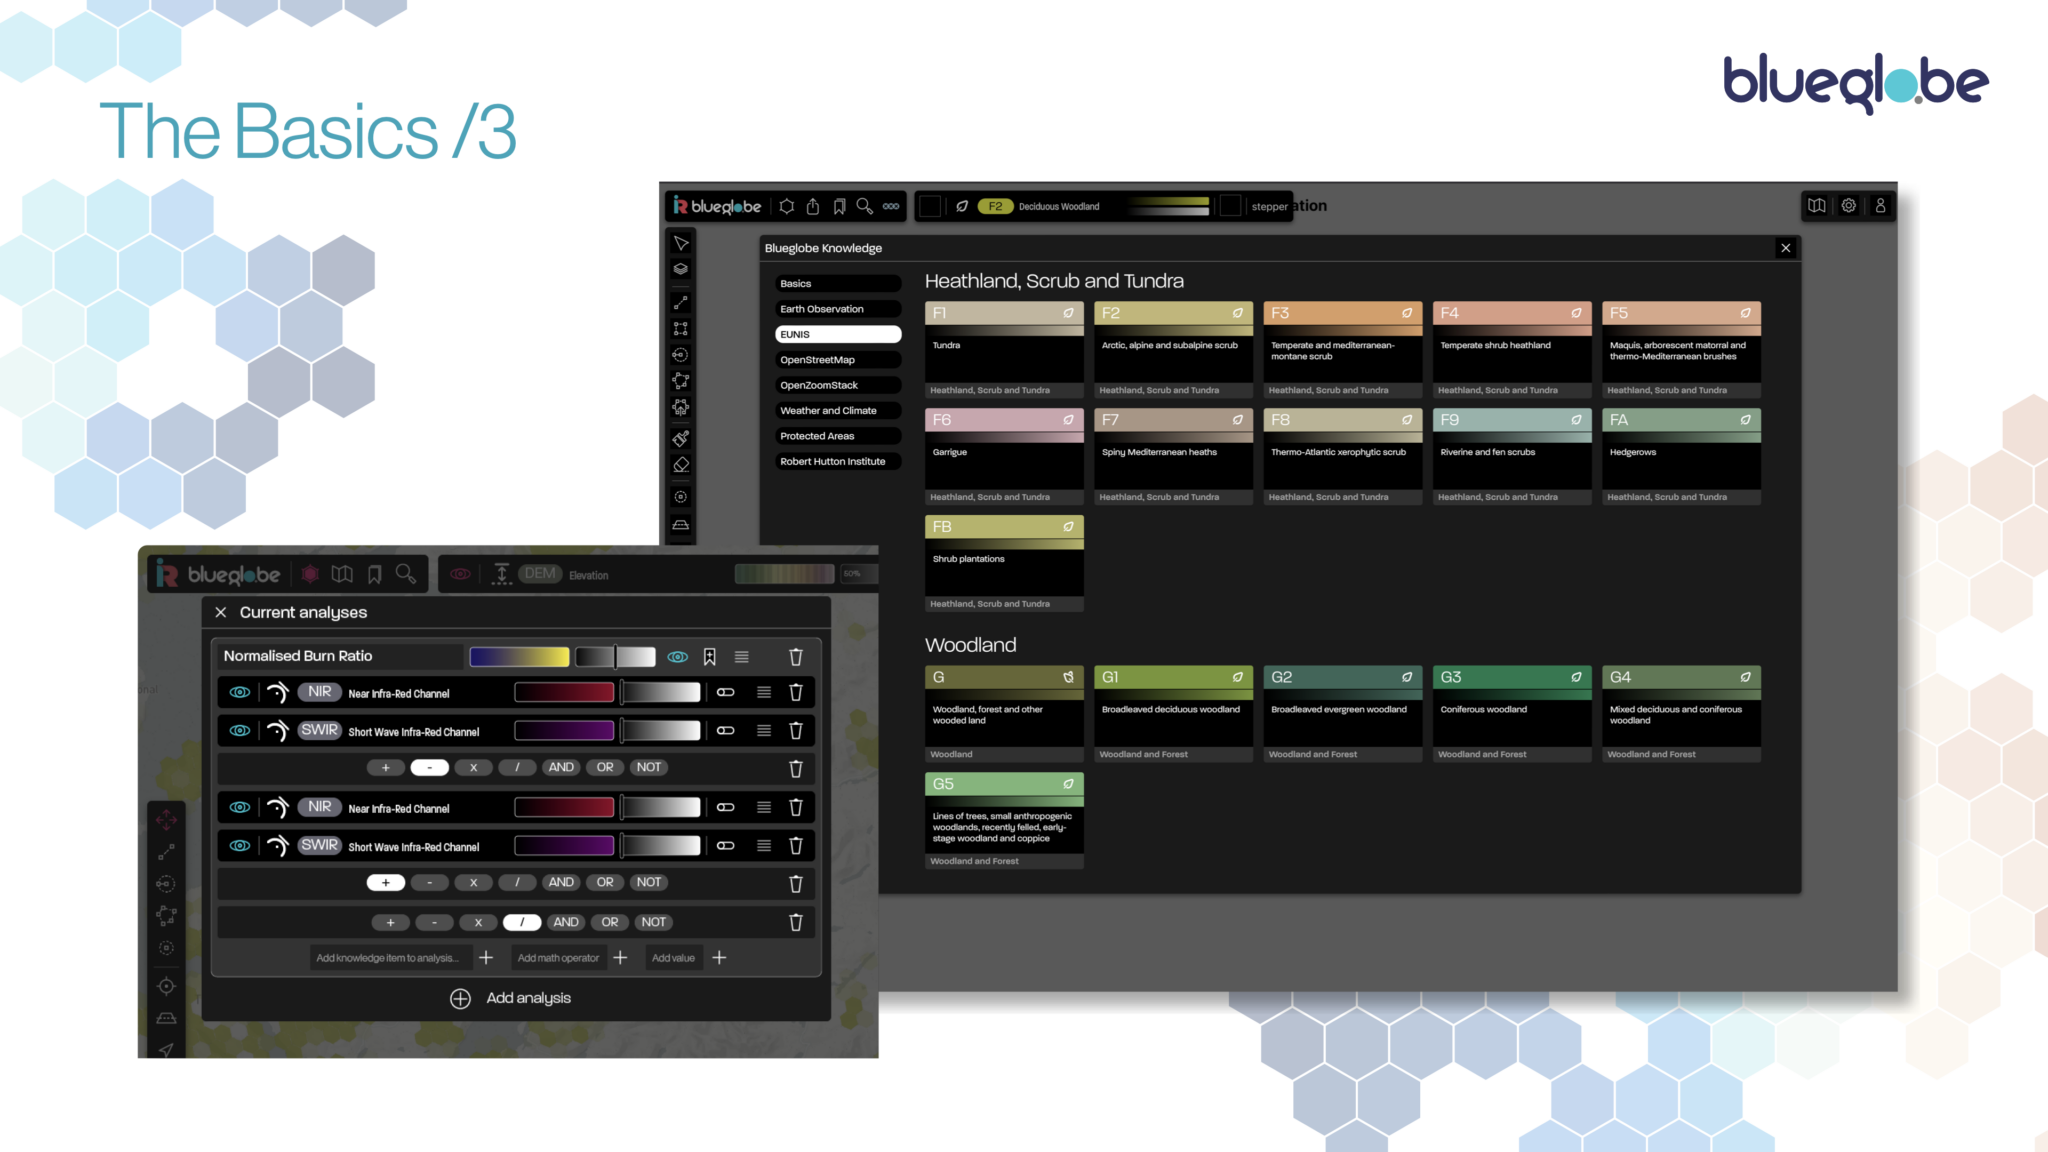
To create visualisations from multivariate data, we are creating a graphical interface to support the building of compound applications and models from core elements, creating and visualising customised analytic measures. The modular approach ensures that, every time we develop an application that requires new attributes or analytics, these become available to the ‘roll your own’ interface.
Applications themselves cover information provision, impact assessment and forecasting for specific sites and wider landscape discovery for comparability, trends, patterns and networks. As we further develop BlueGlobe’s capabilities, we will be able to develop goal-driven tools which work backwards from environmental, social and commercial goals to identify and recommend balanced approaches to meet those goals.
That aside, we do very much believe in the benefits of a “Digital Commons” – providing a core, open access, data and tool platform to enable and support initiatives by non-experts and by communities and voluntary bodies.
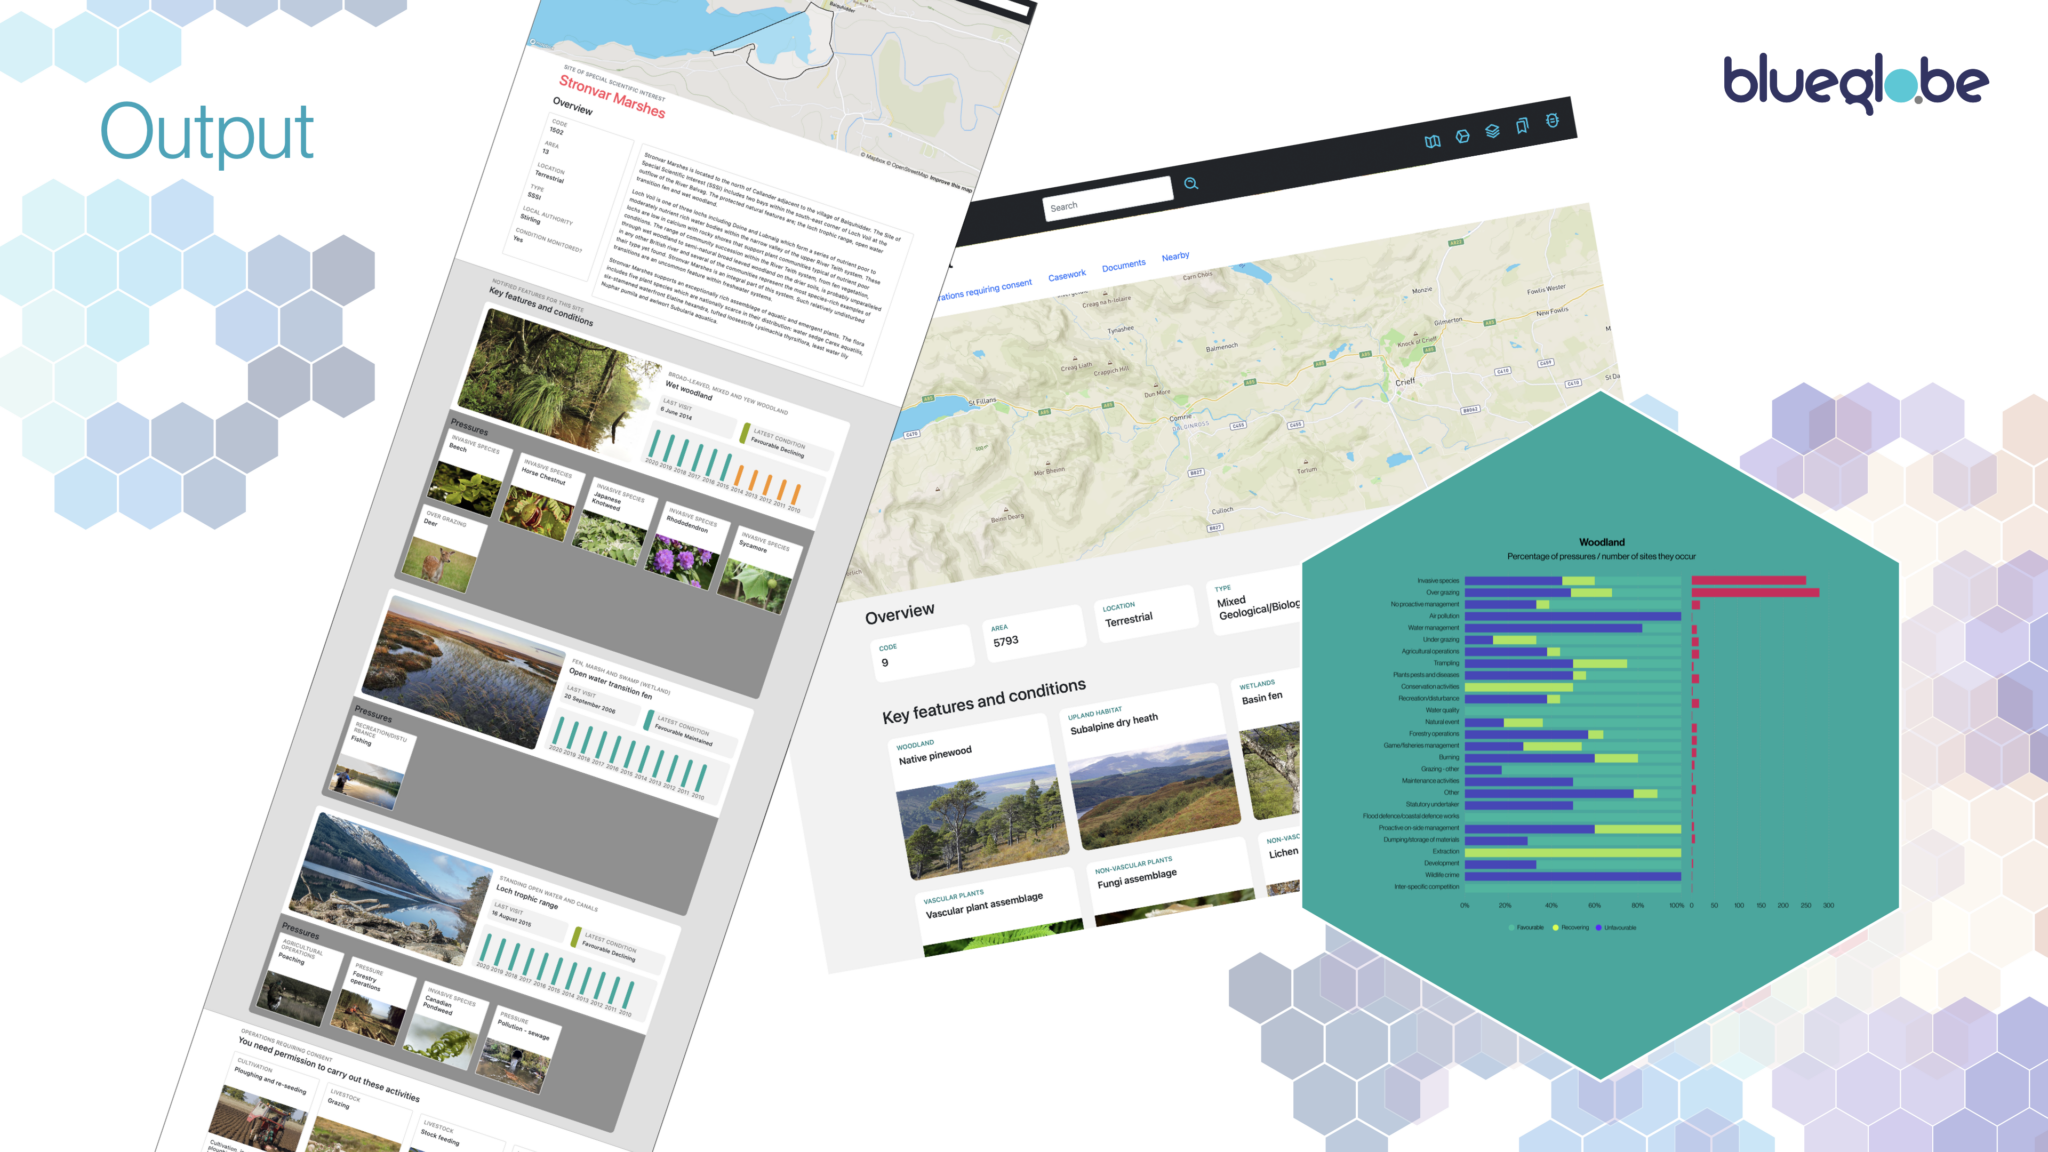
Sophisticated visualisations are one thing, whether on screen, mobile device or via augmented and virtual reality, but their output also needs to be communicated beyond the system itself.
So we can generate output automatically against existing and custom templates and reporting requirements. We also use generative AI to create narrative reports. We’ve tested and validated this approach against the well-known issues of generative AIs ability to draw false conclusions from overly sparse data and are happy to say that we think that we’ve cracked that one, helping remove the reporting and presentation overheads with which we’re all too familiar.
Here we see generative output from the system summarising the state and trends for a couple of protected sites – an SSSI and a National Nature Reserve – in Scotland, plus an automated summary of site pressures and trends on Woodland habitats across multiple sites
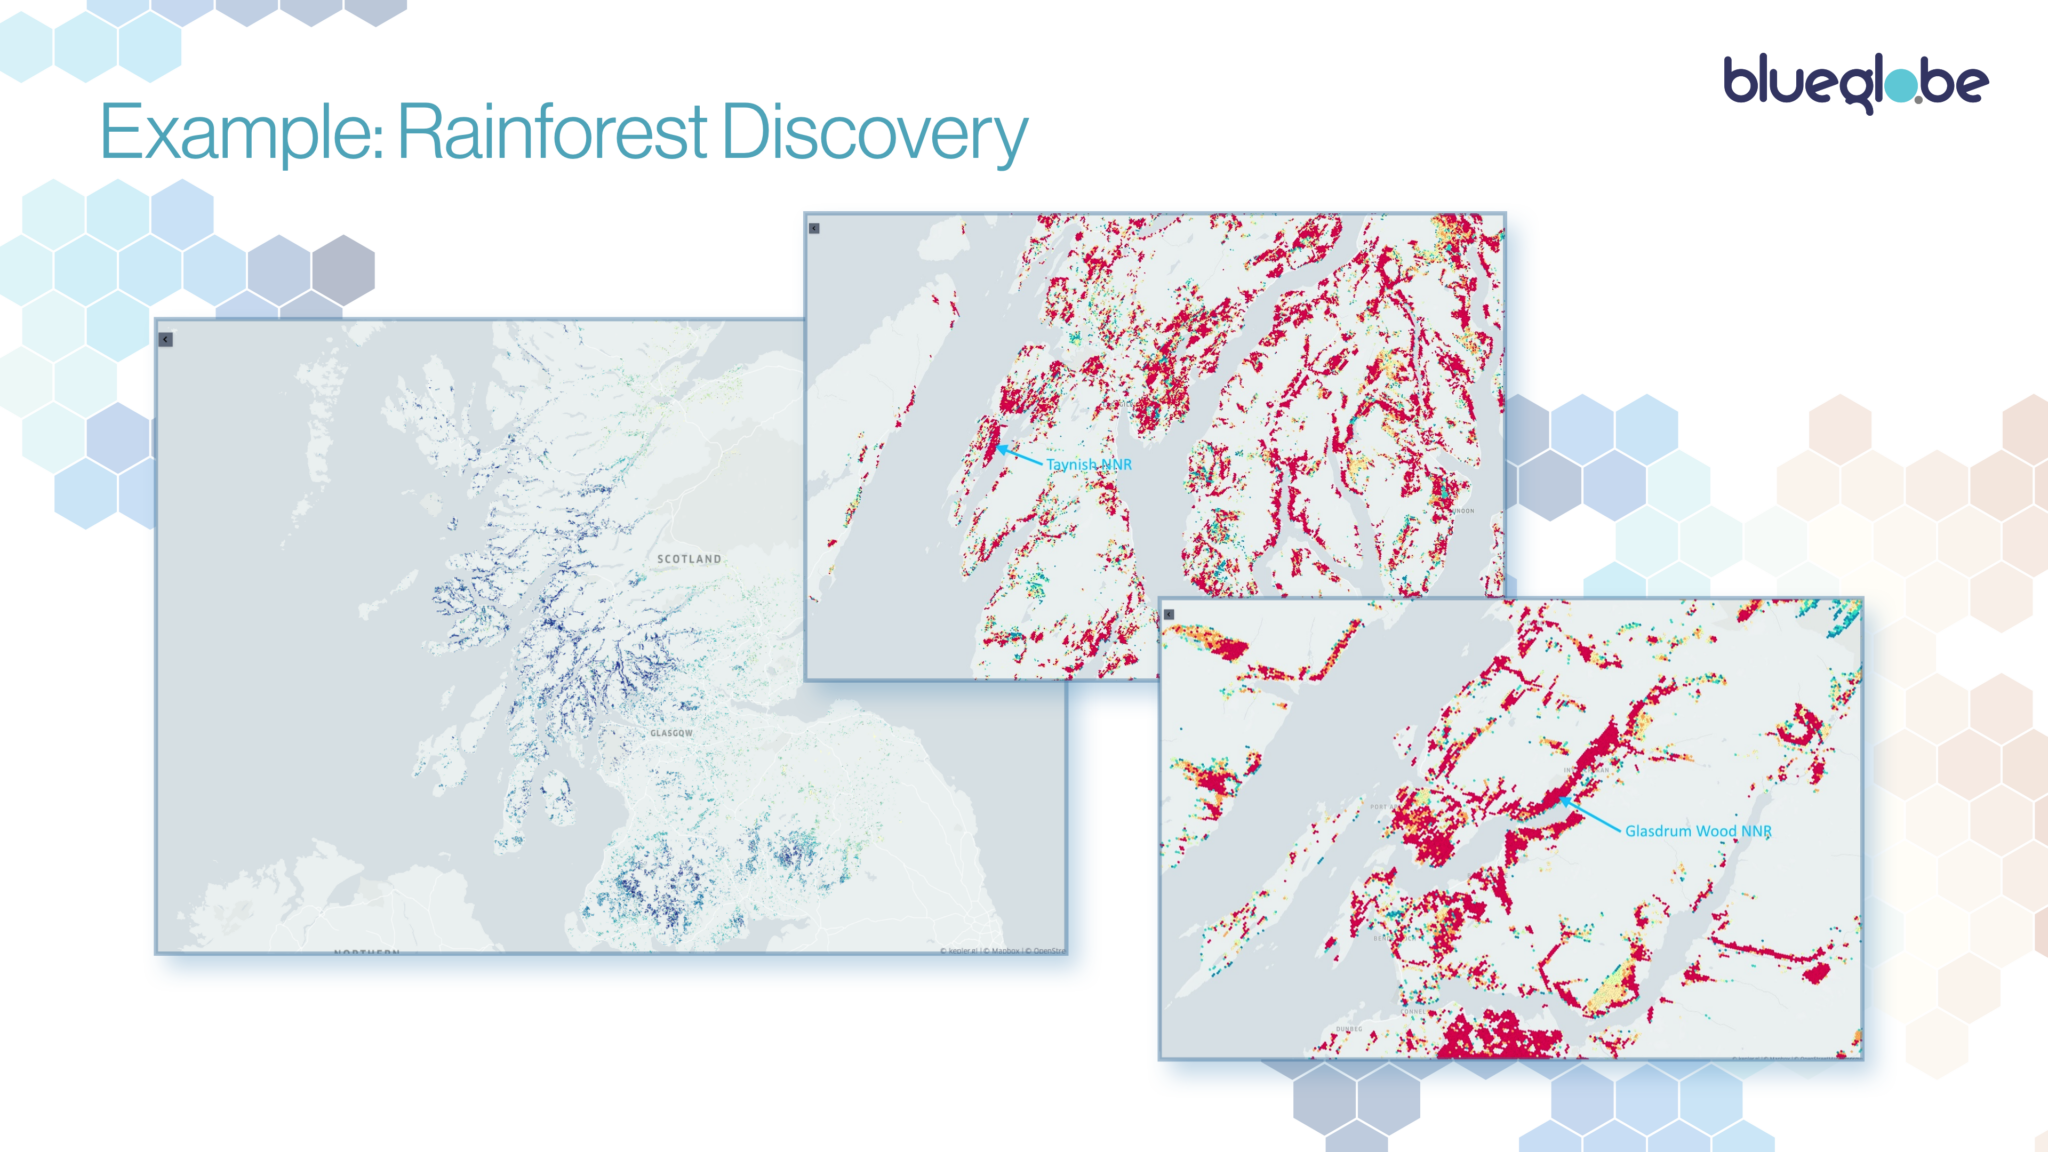
Given the time limit, I’m now going to dive a little further into just one example, amongst the many:
Scotland is recognised as a “Goldilocks” zone for temperate rainforests – not too hot, not too cold and not too dry or wet. They’re defined by a complex mixture of species, aspect, topography and climate, requiring heavy rain and mist and to not be exposed to temperatures below freezing point. Species of particular interest include a wide variety of lichens, bryophytes – mosses and liverworts – where the UK has around 60% of Europe’s species, individually and as assemblages of species.
A number of reports have been produced in recent years, examining the state of known rainforest sites, and making estimates of the overall area that either already meets the definition of rainforest or which could, with appropriate management, develop a rainforest habitat.
The problem with these is that they’re manual exercises and one-off snapshots. They are also perforce rather crude, using either basic single indicators such as a simplified hygrothermic index or a very limited range of records. They are also restricted in coverage and take a long time to produce.
We like a challenge, so we started from two ends: firstly, a parametric approach where we plugged in and refined all the attributes that we thought might surface rainforest candidate areas and, secondly, inferentially, using existing sites as exemplars to train an AI. The inferential approach didn’t work, due to poor site boundary definition and a very limited data set. We had much better results from the parametric model, using topographic, climate, habitat and spectroscopic data. Interestingly, species data records proved too sparse to be useful.
Our first cut was a loose model that took 8 hours to run and produced some hilariously improbable results. So we refined it, added more data and optimised the algorithms: it produced much tighter output, and in about half an hour. For the third iteration, we included the UK’s Hadley 1km2 climate data set and came up with a tighter model again, which not only identifies existing sites without foreknowledge (a good thing) but which identifies plausible candidate areas at high probability, where ground truthing suggests that we’ve developed a useful model. This now runs in four seconds for the whole of Scotland.
What we have come up with is, at an 85% confidence, of 1,290 km2 or 129,000 hectares of Scotland’s land mass as either containing or being potentially suitable for temperate rainforest. That’s about 4x the 2019 estimate from the Woodland Trust, but that was based on known sites, so is entirely plausible and gives us a candidate area for further validation and refinement.
The point though is that the more data we throw at this, the better the performance of the system becomes, and the model for this – or any other discovery application – takes minutes to reconfigure, refine and rerun.
As I said, that’s just one example: we’ve also developed development impact forecasting for some 300 development activities against Biodiversity Net Gain (BNG) 3, inclusion of which is now mandatory for planning applications in England and we are now extending this to include both immediate and ‘downstream’ environmental impacts.
We can use a similar discovery/clustering approach to identify Nature networks for 30×30 commitments, have worked worked with the university of Evora in Portugal to create water quality forecasting for blue-green algae blooms, and have developed a forecasting tool for Covid-19 that proved 80% accurate – ie with calculated error margins – to 14 days. We are now developing a wider range of core analytic tools, including data-driven dynamic habitat clustering and microclimate modelling.
We’ve been largely working under the radar so far, as we wanted to reach a critical mass of demonstrable capability before going public. We did however win the 2022 CogX global award for best AI for Climate tech and, thanks to the good offices of the University of Edinburgh’s Bayes Centre, were a UK nominee to the Earthshot prize that year.
To date, we’ve been self-funded and supported by UKRI grants and SBRI R&D contracts, the latter working with NatureScot.
We’re now able to rapidly build customer applications but are going through a VC round aimed at taking us to full service delivery of generic services, sector-specific applications and the provision of integrated data stacks, so hopefully you’ll hear rather more from us in the coming year.
The point for today though is that, to generate meaningful intelligence from multivariate data, you need to create a unified, navigable and source agnostic framework as a working baseline. It’s necessary, but – and please believe me – it isn’t easy, but if any such system is able to dramatically improve the quality, accessibility and timeliness of decision making, it has achieved its goal.
I started with a movie reference, to Everything, Everywhere, All At Once, which nicely encapsulates the potential of this approach. I’ll finish with another movie reference: if Don’t Look Up isn’t to be regarded from whatever future we have as a documentary, we need to start making properly informed decisions. Hopefully we can help here.
All content Copyright © Intelligent Reality, 2019-2024
