
“Reality is one, though wise men speak of it variously.”
Hindu Veda Rigveda, c.1500BCE
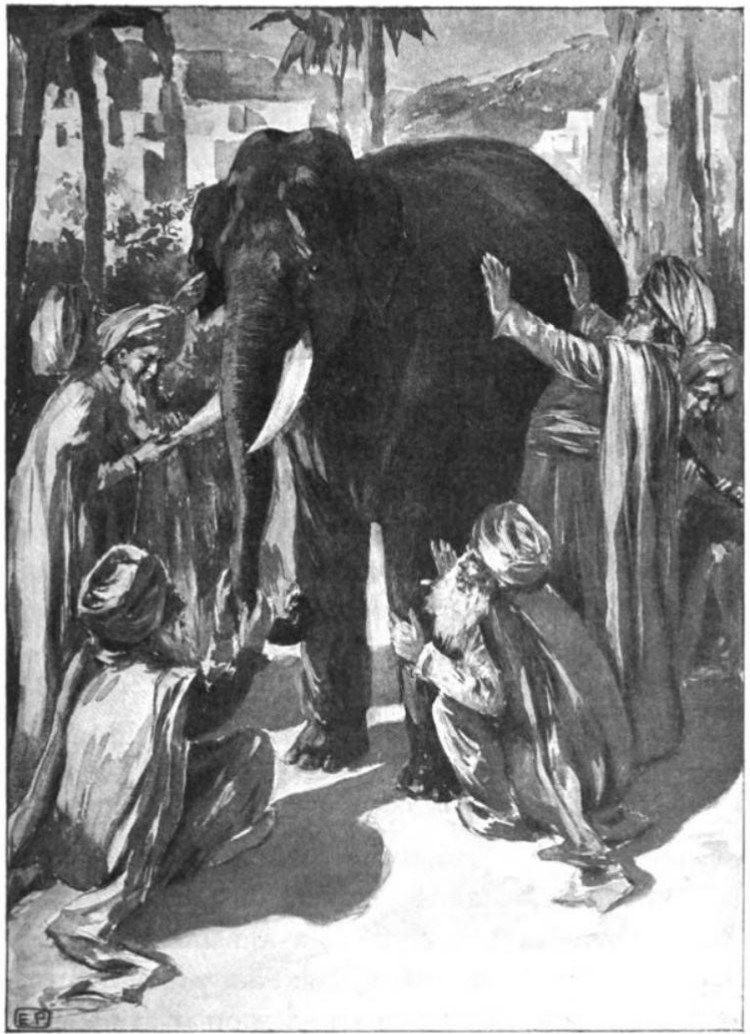
There’s a well-known Buddhist parable, involving four blind men1 and their first encounter with an elephant. Each feels a different part of the elephant, comes to a different conclusion and, depending on which version you read, they either assume that each is interacting with a different beast or come to blows over their differing conclusions: the first feels the trunk and believes it to be a large snake; the second, the leg, concluding it to be a tree trunk, the third the tail, thinking it a rope and the fourth, a tusk, deciding that it’s a spear. What the elephant thought of the experience is not recorded.
This is a pretty good metaphor for how we interpret environmental and climate data, with the parts of the blind men here played by the multiplicity of perceptual lenses through which we look at geospatial data: each provides a partial view into the larger picture, but has the propensity to generate incomplete or misleading conclusions from limited data and from the cognitive biases of each tool and its users.
Geographic Information Systems (GIS), satellite images, sensor networks, ground surveys, drone data, environmental sampling and demographic and socioeconomic records don’t readily come together to create a holistic understanding of the state and direction of the world as a whole or of any aspect of it. That holistic view is however exactly what we need in order to make informed decisions to address the intertwined and existential challenges of environmental degradation and climate change.
Services such as Google Earth Engine and the ArcGIS Living Atlas are data aggregators: they provide multiple data sets, each of which can be visually overlaid on a map background. If you want to understand how different attributes of an area interact and contribute to the overall characterisation of an area, it’s then down to you to either work it out in your Mk 1 brain or to explicitly combine data for a given area and analyse the outcomes. And good luck doing that with more than a handful of sources. Even within those limits, you can’t then follow patterns across the landscape and, when you want to look at a different area, you have to start again. Very quaint, and very 20th century.
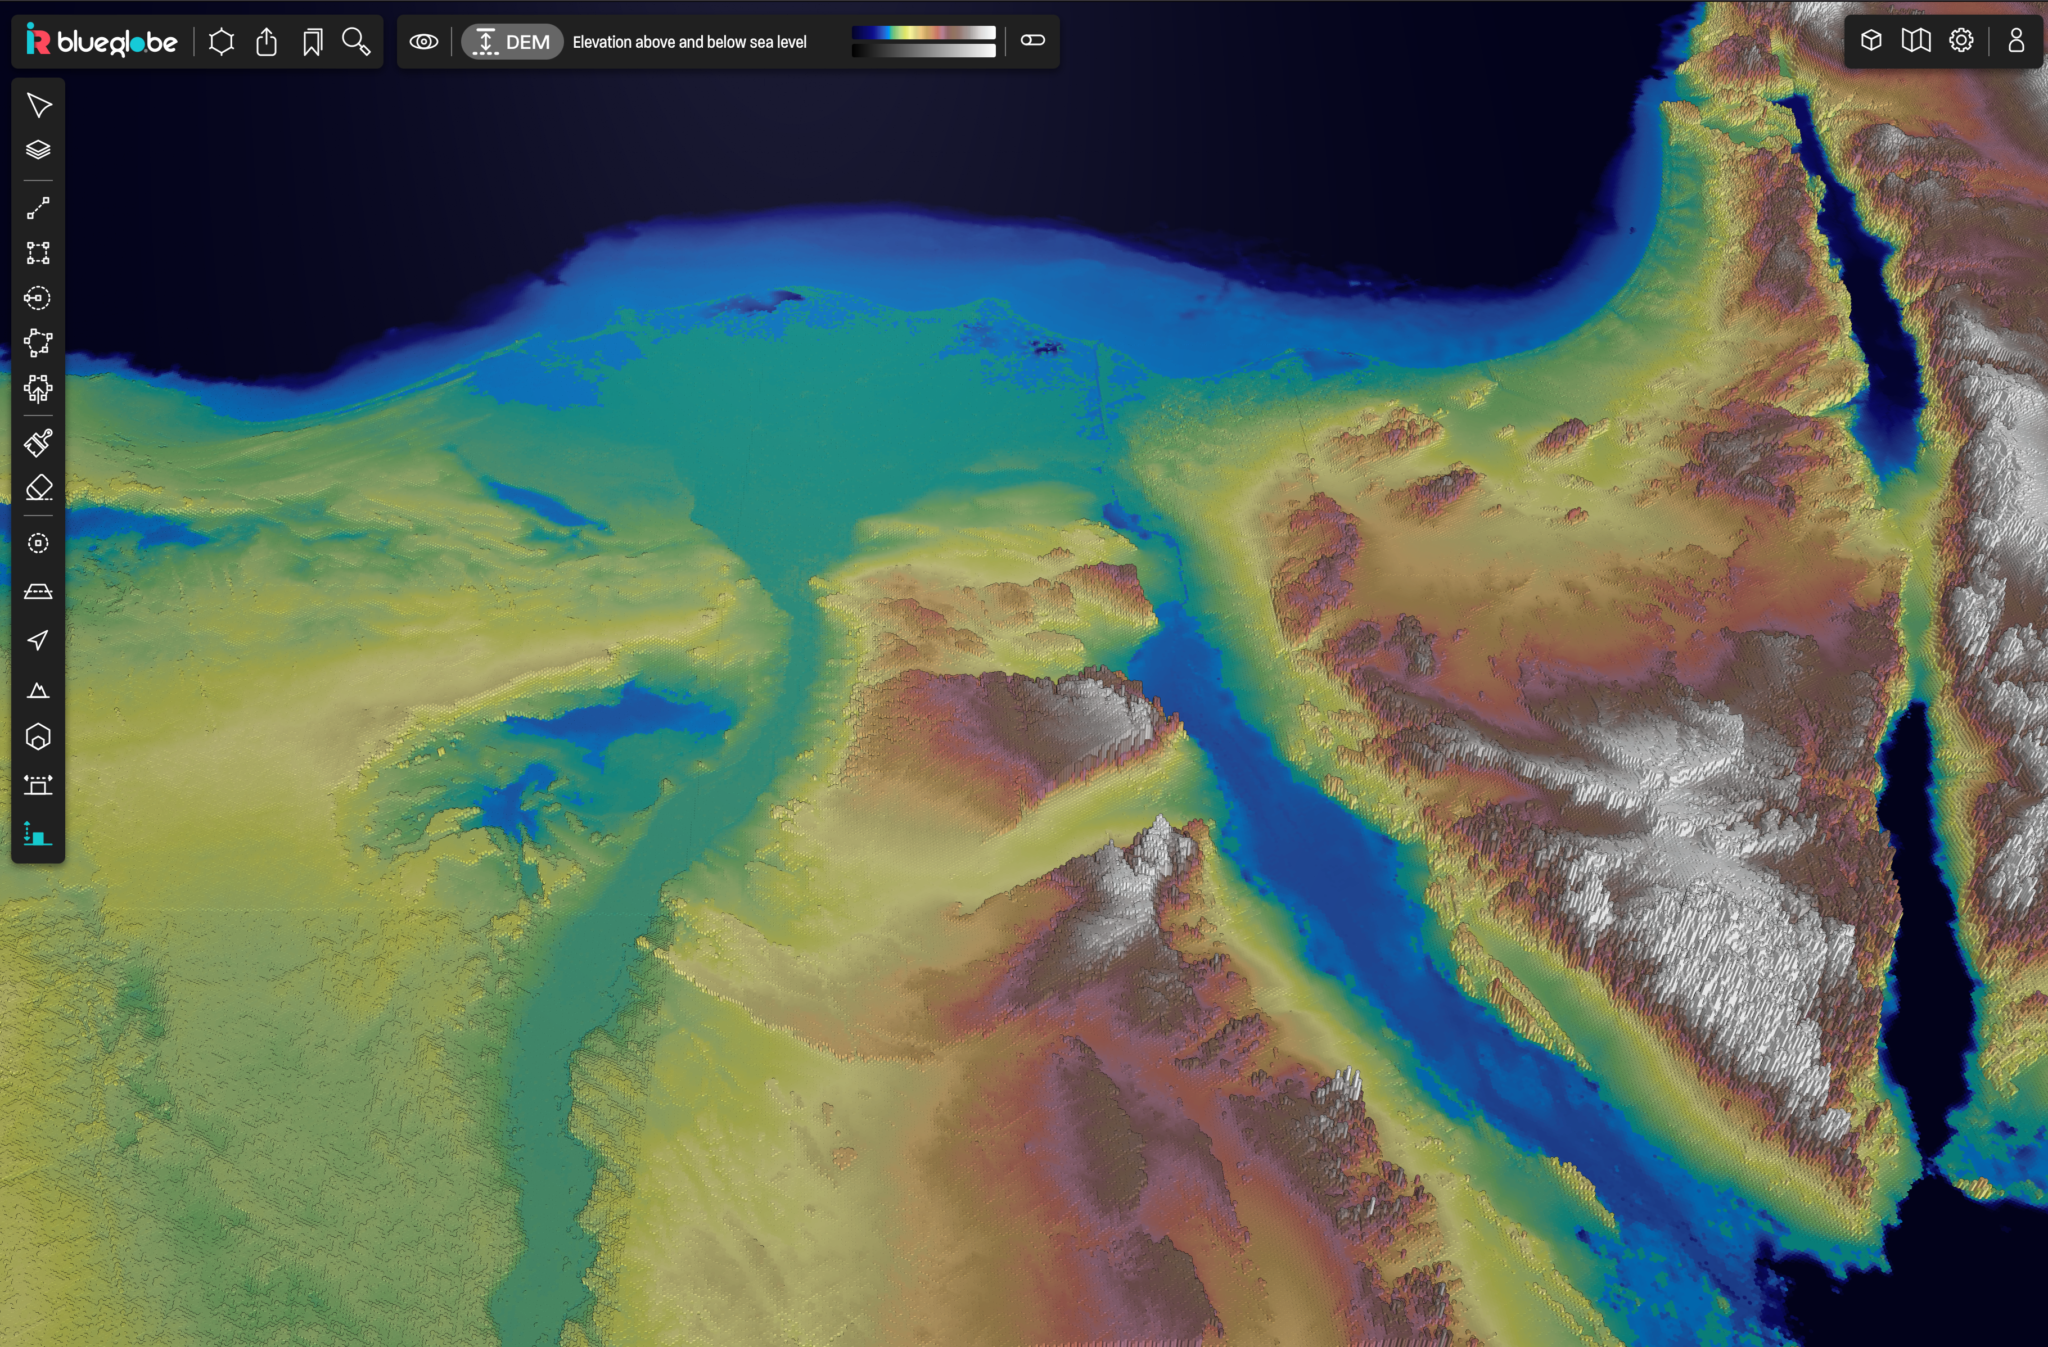
BlueGlobe computational reconstruction of the Nile Delta, including height and depth data
Aggregators vs Integrators
BlueGlobe provides an online computational model of the world. At its most basic, it is a data integrator: it combines a huge and ever expanding range of data sources to create unified data stacks for any area, at multiple resolutions. This takes place inside a computational framework that enables algorithms to ‘walk’ across the landscape by any chosen data, metric, analysis or pattern. By doing so, it allows both interactive exploration and direct driving of both inferential (AI) and parametric (model-based) tools. This enables it to generate insights and forecasts based on any combination of data, to compare areas and to identify and follow patterns, metrics and analyses and across the landscape. This is 21st century data intelligence.
The Whole Elephant
Returning to our parable, BlueGlobe gives you a manageable and faithful model that says, “See, this is what an elephant is – now which part of it do you want to explore?” then allows you to get on with doing so. We can then move on to questions like, “How many other elephants do you think are there?” and, “What makes elephants appear?” and, of course, “Where else might they appear?”
This is why we call BlueGlobe, ‘Earth’s Digital Twin’ – it’s a continuously updated synthesis of what is happening in our climate and environment, from the global to the hyperlocal and one which continually improves as more data is thrown at it.

BlueGlobe: Discovery Informs Design
WIth constant refinement, the global climate models have proven robust and effective over more than thirty years. There is however a gap between what those models tell us and what we need to be able to explore and test in order to formulate policy and action and to forecast and monitor outcomes. That applies whether it’s for national or local governments, government agencies, NGOs, land owners and managers, commercial enterprises and communities. BlueGlobe is designed to fill that gap.
Model-driven systems are parametric – they use selected data to validate a particular hypothesis (the model), helping identify cause from correlation within specific data sets. BlueGlobe’s computational model can support parametric discovery and validation, but from arbitrary data and for any location, and at any scale.
BlueGlobe can also take an inferential approach, using its AI to look at all the data and emergently identify correlations, patterns and networks hidden within the data. This helps surface not just the things you knew to look for, but those you need to know and don’t know about in advance.
The two approaches then work together – inferential discovery of correlations – patterns, trends and connections – can drive the creation and testing of new hypothesis-based models to separate cause from correlation, thereby extending the range and scope of our understanding of what’s happening to our world, in the process allowing ‘what if?’ modelling of the potential impact of considered actions.
The big message from 2023 is that climate change is accelerating, and is likely crossing multiple tipping points whose timing, drivers and interactions we can’t precisely determine. We need therefore to be able to freely explore and analyse that emerging and unified data and use what we find to rapidly make informed decisions and to continuously monitor and refine the outcomes. The enemy here is continuity thinking – continuing to indulge in the rigid and wishful thinking of ineffective offsets and carbon credits or in pursuing blind alleys that, “seemed like a good idea at the time…” or which represent the narrow dogmata of particular groups.
BlueGlobe is designed to support that transition to data-driven discovery and decision making.